Federal Home Loan Mortgage Corp. Files 10-Q for Period Ending March 31, 2024
Ticker: FMCKK · Form: 10-Q · Filed: May 1, 2024 · CIK: 1026214
| Field | Detail |
|---|---|
| Company | Federal Home Loan Mortgage Corp (FMCKK) |
| Form Type | 10-Q |
| Filed Date | May 1, 2024 |
| Risk Level | medium |
| Pages | 14 |
| Reading Time | 17 min |
| Key Dollar Amounts | $2.8 b, $5.8 b, $50.5 billion, $39.1 billion, $120.4 billion |
| Sentiment | neutral |
Sentiment: neutral
Topics: 10-Q, Federal Home Loan Mortgage Corp, Financial Report, Q1 2024, Housing Finance
TL;DR
<b>Federal Home Loan Mortgage Corp. has filed its Q1 2024 10-Q report.</b>
AI Summary
FEDERAL HOME LOAN MORTGAGE CORP (FMCKK) filed a Quarterly Report (10-Q) with the SEC on May 1, 2024. Federal Home Loan Mortgage Corp. filed a 10-Q report for the period ending March 31, 2024. The filing covers the first quarter of 2024. The company's fiscal year ends on December 31st. The filing was made on May 1, 2024. The company's principal business address is 8200 Jones Branch Dr, McLean, VA 22102.
Why It Matters
For investors and stakeholders tracking FEDERAL HOME LOAN MORTGAGE CORP, this filing contains several important signals. This 10-Q filing provides a quarterly update on the financial performance and operational status of Federal Home Loan Mortgage Corp. Investors and analysts can use this report to assess the company's financial health, identify trends, and make informed investment decisions.
Risk Assessment
Risk Level: medium — FEDERAL HOME LOAN MORTGAGE CORP shows moderate risk based on this filing. The company operates in the highly regulated housing finance sector, which is subject to significant government oversight and potential policy changes.
Analyst Insight
Monitor future filings for updates on regulatory changes and their impact on the company's financial performance.
Key Numbers
- 2024-03-31 — Period End Date (CONFORMED PERIOD OF REPORT)
- 2024-05-01 — Filing Date (FILED AS OF DATE)
- 2024-01-01 — Quarter Start Date (2024-01-01 2024-03-31)
- 2023-01-01 — Prior Year Quarter Start Date (2023-01-01 2023-03-31)
Key Players & Entities
- FEDERAL HOME LOAN MORTGAGE CORP (company) — FILER
- 2024-03-31 (date) — CONFORMED PERIOD OF REPORT
- 2024-05-01 (date) — FILED AS OF DATE
- 8200 JONES BRANCH DR (address) — BUSINESS ADDRESS
- MCLEAN (location) — BUSINESS ADDRESS CITY
- VA (state) — BUSINESS ADDRESS STATE
- 22102 (zip_code) — BUSINESS ADDRESS ZIP
- 7039032000 (phone_number) — BUSINESS PHONE
FAQ
When did FEDERAL HOME LOAN MORTGAGE CORP file this 10-Q?
FEDERAL HOME LOAN MORTGAGE CORP filed this Quarterly Report (10-Q) with the SEC on May 1, 2024.
What is a 10-Q filing?
A 10-Q is a quarterly financial report with unaudited financials, management discussion, and interim business updates. This particular 10-Q was filed by FEDERAL HOME LOAN MORTGAGE CORP (FMCKK).
Where can I read the original 10-Q filing from FEDERAL HOME LOAN MORTGAGE CORP?
You can access the original filing directly on the SEC's EDGAR system. The filing is publicly available and includes all exhibits and attachments submitted by FEDERAL HOME LOAN MORTGAGE CORP.
What are the key takeaways from FEDERAL HOME LOAN MORTGAGE CORP's 10-Q?
FEDERAL HOME LOAN MORTGAGE CORP filed this 10-Q on May 1, 2024. Key takeaways: Federal Home Loan Mortgage Corp. filed a 10-Q report for the period ending March 31, 2024.. The filing covers the first quarter of 2024.. The company's fiscal year ends on December 31st..
Is FEDERAL HOME LOAN MORTGAGE CORP a risky investment based on this filing?
Based on this 10-Q, FEDERAL HOME LOAN MORTGAGE CORP presents a moderate-risk profile. The company operates in the highly regulated housing finance sector, which is subject to significant government oversight and potential policy changes.
What should investors do after reading FEDERAL HOME LOAN MORTGAGE CORP's 10-Q?
Monitor future filings for updates on regulatory changes and their impact on the company's financial performance. The overall sentiment from this filing is neutral.
How does FEDERAL HOME LOAN MORTGAGE CORP compare to its industry peers?
Federal Home Loan Mortgage Corp. is a government-sponsored enterprise that plays a critical role in the U.S. housing finance system by providing liquidity, stability, and affordability to the mortgage market.
Are there regulatory concerns for FEDERAL HOME LOAN MORTGAGE CORP?
As a federally chartered corporation, Federal Home Loan Mortgage Corp. is subject to extensive regulation and oversight by government agencies, impacting its operations and financial structure.
Industry Context
Federal Home Loan Mortgage Corp. is a government-sponsored enterprise that plays a critical role in the U.S. housing finance system by providing liquidity, stability, and affordability to the mortgage market.
Regulatory Implications
As a federally chartered corporation, Federal Home Loan Mortgage Corp. is subject to extensive regulation and oversight by government agencies, impacting its operations and financial structure.
What Investors Should Do
- Review the detailed financial statements within the 10-Q for specific revenue, expense, and balance sheet figures.
- Analyze any disclosures regarding risk factors or legal proceedings to understand potential challenges.
- Compare the Q1 2024 results with previous periods to identify performance trends and changes.
Year-Over-Year Comparison
This filing represents the quarterly report for the period ending March 31, 2024, providing updated financial information compared to previous filings.
Filing Stats: 4,338 words · 17 min read · ~14 pages · Grade level 15.2 · Accepted 2024-05-01 07:57:25
Key Financial Figures
- $2.8 b — lions) Key Drivers: n Net income was $2.8 billion, an increase of 39% year-over-yea
- $5.8 b — gher net revenues. n Net revenues were $5.8 billion, an increase of 19% year-over-yea
- $50.5 billion — r non-interest income. n Net worth was $50.5 billion as of March 31, 2024, up from $39.1 bil
- $39.1 billion — 5 billion as of March 31, 2024, up from $39.1 billion as of March 31, 2023. The quarterly inc
- $120.4 billion — rence of the senior preferred stock was $120.4 billion on March 31, 2024, and will increase to
- $123.1 billion — on March 31, 2024, and will increase to $123.1 billion on June 30, 2024 based on the increase
- $71 billion — well as for rental housing. We provided $71 billion in liquidity to the mortgage market in
- $3.5 — ortfolio increased 2% year-over-year to $3.5 trillion at March 31, 2024, continuing
- $3.0 — ur Single-Family mortgage portfolio was $3.0 trillion at March 31, 2024, up 2% year-
- $443 billion — Our Multifamily mortgage portfolio was $443 billion at March 31, 2024, up 4% year-over-year
- $4,759 — Q 2024 1Q 2023 $ % Net interest income $4,759 $4,501 $258 6 % Non-interest income 99
- $4,501 — 1Q 2023 $ % Net interest income $4,759 $4,501 $258 6 % Non-interest income 998 326 6
- $258 — $ % Net interest income $4,759 $4,501 $258 6 % Non-interest income 998 326 672 20
- $2,741 — 25) 54 (79) (146) Comprehensive income $2,741 $2,049 $692 34 % Net Revenues Net In
- $2,049 — (79) (146) Comprehensive income $2,741 $2,049 $692 34 % Net Revenues Net Interest
Filing Documents
- fmcc-20240331.htm (10-Q) — 4218KB
- a1q2410qex41.htm (EX-4.1) — 232KB
- a1q2410qex101.htm (EX-10.1) — 31KB
- a1q2410qex311.htm (EX-31.1) — 19KB
- a1q2410qex312.htm (EX-31.2) — 18KB
- a1q2410qex321.htm (EX-32.1) — 7KB
- a1q2410qex322.htm (EX-32.2) — 7KB
- fmcc-20240331_g1.jpg (GRAPHIC) — 14KB
- fmcc-20240331_g10.jpg (GRAPHIC) — 36KB
- fmcc-20240331_g11.jpg (GRAPHIC) — 50KB
- fmcc-20240331_g12.jpg (GRAPHIC) — 64KB
- fmcc-20240331_g13.jpg (GRAPHIC) — 26KB
- fmcc-20240331_g14.jpg (GRAPHIC) — 60KB
- fmcc-20240331_g15.jpg (GRAPHIC) — 53KB
- fmcc-20240331_g16.jpg (GRAPHIC) — 43KB
- fmcc-20240331_g17.jpg (GRAPHIC) — 38KB
- fmcc-20240331_g18.jpg (GRAPHIC) — 64KB
- fmcc-20240331_g19.jpg (GRAPHIC) — 66KB
- fmcc-20240331_g2.jpg (GRAPHIC) — 40KB
- fmcc-20240331_g20.jpg (GRAPHIC) — 65KB
- fmcc-20240331_g21.jpg (GRAPHIC) — 60KB
- fmcc-20240331_g22.jpg (GRAPHIC) — 37KB
- fmcc-20240331_g23.jpg (GRAPHIC) — 35KB
- fmcc-20240331_g24.jpg (GRAPHIC) — 30KB
- fmcc-20240331_g25.jpg (GRAPHIC) — 28KB
- fmcc-20240331_g26.jpg (GRAPHIC) — 34KB
- fmcc-20240331_g27.jpg (GRAPHIC) — 75KB
- fmcc-20240331_g28.jpg (GRAPHIC) — 29KB
- fmcc-20240331_g29.jpg (GRAPHIC) — 29KB
- fmcc-20240331_g3.jpg (GRAPHIC) — 32KB
- fmcc-20240331_g30.jpg (GRAPHIC) — 27KB
- fmcc-20240331_g31.jpg (GRAPHIC) — 26KB
- fmcc-20240331_g32.jpg (GRAPHIC) — 27KB
- fmcc-20240331_g33.jpg (GRAPHIC) — 82KB
- fmcc-20240331_g34.jpg (GRAPHIC) — 29KB
- fmcc-20240331_g35.jpg (GRAPHIC) — 27KB
- fmcc-20240331_g36.jpg (GRAPHIC) — 70KB
- fmcc-20240331_g37.jpg (GRAPHIC) — 54KB
- fmcc-20240331_g4.jpg (GRAPHIC) — 61KB
- fmcc-20240331_g5.jpg (GRAPHIC) — 69KB
- fmcc-20240331_g6.jpg (GRAPHIC) — 46KB
- fmcc-20240331_g7.jpg (GRAPHIC) — 42KB
- fmcc-20240331_g8.jpg (GRAPHIC) — 63KB
- fmcc-20240331_g9.jpg (GRAPHIC) — 39KB
- sofr.jpg (GRAPHIC) — 4KB
- 0001026214-24-000039.txt ( ) — 24758KB
- fmcc-20240331.xsd (EX-101.SCH) — 92KB
- fmcc-20240331_cal.xml (EX-101.CAL) — 81KB
- fmcc-20240331_def.xml (EX-101.DEF) — 672KB
- fmcc-20240331_lab.xml (EX-101.LAB) — 1005KB
- fmcc-20240331_pre.xml (EX-101.PRE) — 837KB
- fmcc-20240331_htm.xml (XML) — 5131KB
MANAGEMENT'S DISCUSSION AND ANALYSIS OF FINANCIAL CONDITION AND RESULTS OF OPERATIONS 1
MANAGEMENT'S DISCUSSION AND ANALYSIS OF FINANCIAL CONDITION AND RESULTS OF OPERATIONS 1 n Introduction 1 n Housing and Mortgage Market Conditions 4 n Consolidated Results of Operations 6 n Consolidated Balance Sheets Analysis 9 n Our Portfolios 10 n Our Business Segments 12 n Risk Management 21 l Credit Risk 21 l Market Risk 29 n Liquidity and Capital Resources 32 n Critical Accounting Estimates 39 n Regulation and Supervision 40 n Forward-Looking Statements 41
FINANCIAL STATEMENTS 43
FINANCIAL STATEMENTS 43 OTHER INFORMATION 88
CONTROLS AND PROCEDURES 90
CONTROLS AND PROCEDURES 90 EXHIBIT INDEX 91 SIGNATURES 92 FORM 10-Q INDEX 93 Freddie Mac 1Q 2024 Form 10-Q i Table of Contents MD&A TABLE INDEX Table Description Page 1 Summary of Consolidated Statements of Income and Comprehensive Income 6 2 Components of Net Interest Income 6 3 Analysis of Net Interest Yield 7 4 Components of Non-Interest Income 7 5 (Provision) Benefit for Credit Losses 8 6 Components of Non-Interest Expense 8 7 Summarized Condensed Consolidated Balance Sheets 9 8 Mortgage Portfolio 10 9 Mortgage-Related Investments Portfolio 11 10 Other Investments Portfolio 11 11 Single-Family Segment Financial Results 16 12 Multifamily Segment Financial Results 20 13 Allowance for Credit Losses Activity 21 14 Allowance for Credit Losses Ratios 22 15 Single-Family New Business Activity 23 16 Single-Family Mortgage Portfolio Newly Acquired Credit Enhancements 23 17 Single-Family Mortgage Portfolio Credit Enhancement Coverage Outstanding 24 18 Serious Delinquency Rates for Credit-Enhanced and Non-Credit-Enhanced Loans in Our Single-Family Mortgage Portfolio 24 19 Credit Quality Characteristics of Our Single-Family Mortgage Portfolio 25 20 Single-Family Mortgage Portfolio Attribute Combinations 25 21 Single-Family Completed Loan Workout Activity 27 22 Multifamily Mortgage Portfolio CRT Issuance 28 23 Credit-Enhanced and Non-Credit-Enhanced Loans Underlying Our Multifamily Mortgage Portfolio 29 24 Credit Quality of Our Multifamily Mortgage Portfolio Without Credit Enhancement 29 25 PVS-YC and PVS-L Results Assuming Shifts of the Yield Curve 30 26 Duration Gap and PVS Results 30 27 PVS-L Results Before Derivatives and After Derivatives 30 28 Earnings Sensitivity to Changes in Interest Rates 31 29 Liquidity Sources 32 30 Funding Sources 33 31 Debt of Freddie Mac Activity 33 32 Maturity and Redemption Dates 34 33 Debt of Consolidated Trusts Activity 34 34 Net Worth Activity 35 35 Regulat
Management's Discussion and Analysis Introduction
Management's Discussion and Analysis Introduction
Management's Discussion and Analysis of Financial Condition and Results of Operations
Management's Discussion and Analysis of Financial Condition and Results of Operations This Quarterly Report on Form 10-Q includes forward-looking statements that are based on current expectations and that are subject to significant risks and uncertainties. These forward-looking statements are made as of the date of this Form 10-Q. We undertake no obligation to update any forward-looking statement to reflect events or circumstances after the date of this Form 10-Q. Actual results might differ significantly from those described in or implied by such statements due to various factors and uncertainties, including those described in the MD&A - Forward-Looking Statements section of this Form 10-Q and the Introduction and Risk Factors sections of our Annual Report on Form 10-K for the year ended December 31, 2023, or 2023 Annual Report. Throughout this Form 10-Q, we use certain acronyms and terms that are defined in the Glossary of our 2023 Annual Report. You should read the following MD&A in conjunction with our 2023 Annual Report and our condensed consolidated financial statements and accompanying notes for the three months ended March 31, 2024 included in Financial Statements . INTRODUCTION Freddie Mac is a GSE chartered by Congress in 1970, with a mission to provide liquidity, stability, and affordability to the U.S. housing market. We do this primarily by purchasing single-family and multifamily residential mortgage loans originated by lenders. In most instances, we package these loans into guaranteed mortgage-related securities, which are sold in the global capital markets, and transfer interest-rate and liquidity risks to third-party investors. In addition, we transfer a portion of our mortgage credit risk exposure to third-party investors through our credit risk transfer programs, which include securities- and insurance-based offerings. We also invest in mortgage loans, mortgage-related securities, and other types of assets. We do not originate mortgage loans
Management's Discussion and Analysis Introduction
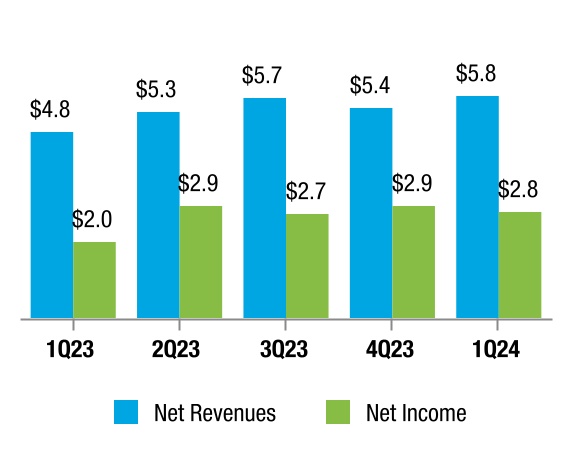
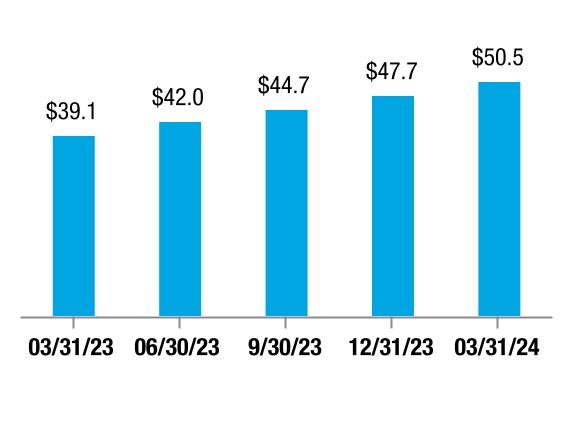
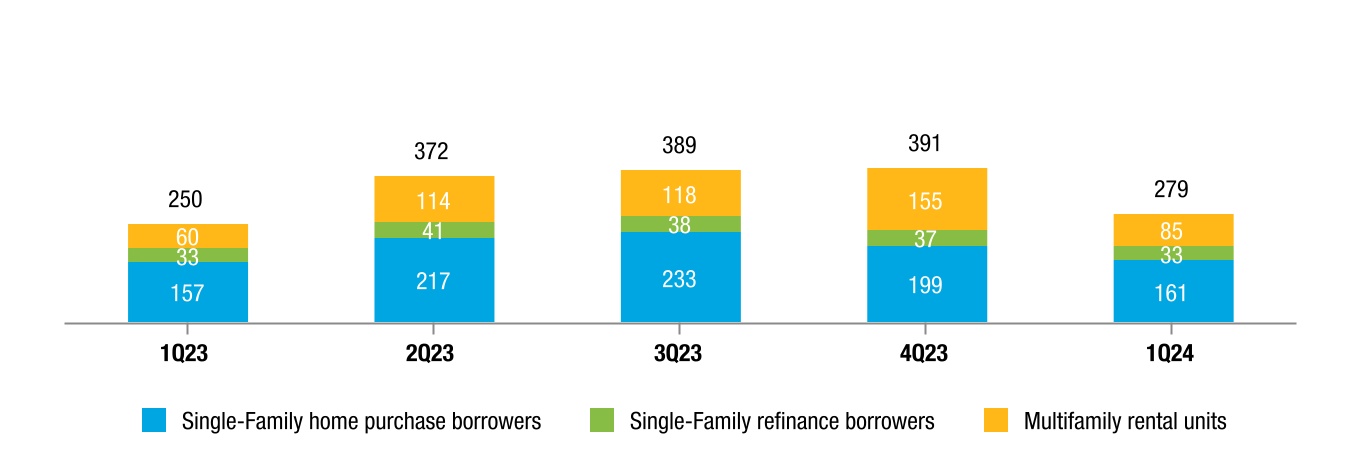
Management's Discussion and Analysis Introduction Business Results Consolidated Financial Results Net Revenues and Net Income (In billions) Net Worth (In billions) Key Drivers: n Net income was $2.8 billion, an increase of 39% year-over-year, primarily driven by higher net revenues. n Net revenues were $5.8 billion, an increase of 19% year-over-year, driven by higher net interest income and higher non-interest income. n Net worth was $50.5 billion as of March 31, 2024, up from $39.1 billion as of March 31, 2023. The quarterly increases in net worth have been, or will be, added to the aggregate liquidation preference of the senior preferred stock. The liquidation preference of the senior preferred stock was $120.4 billion on March 31, 2024, and will increase to $123.1 billion on June 30, 2024 based on the increase in net worth in 1Q 2024. Market Liquidity Market Liquidity (In thousands) We support the U.S. housing market by executing our mission to provide liquidity and help maintain credit availability for new and refinanced single-family mortgages as well as for rental housing. We provided $71 billion in liquidity to the mortgage market in 1Q 2024, which enabled the financing of 279,000 home purchases, refinancings, and rental units. Freddie Mac 1Q 2024 Form 10-Q 2
Management's Discussion and Analysis Introduction
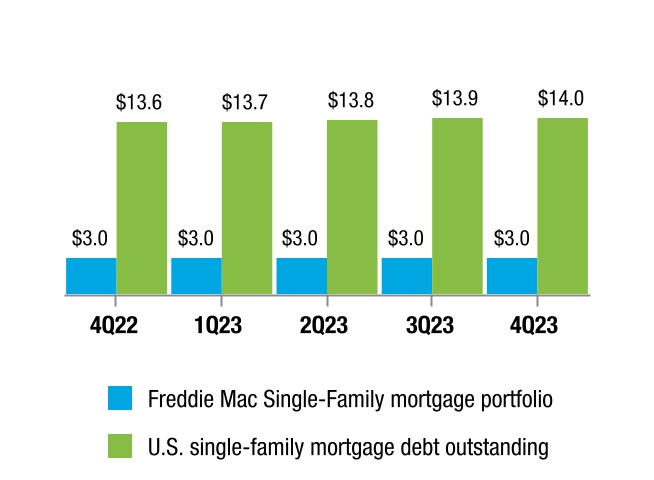
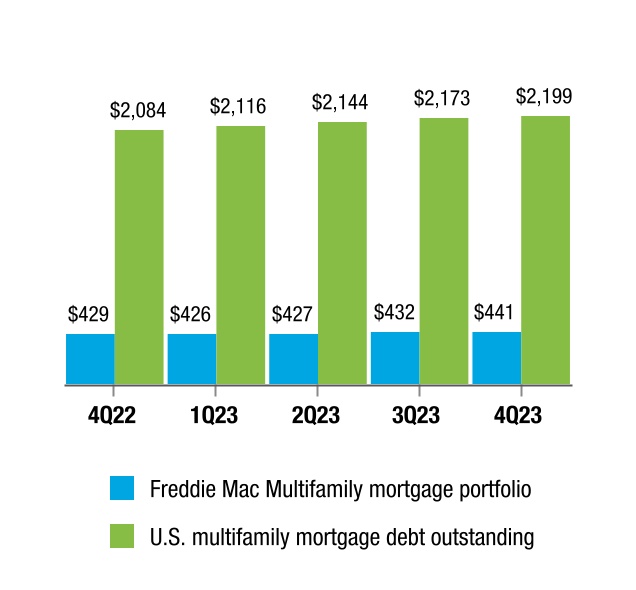
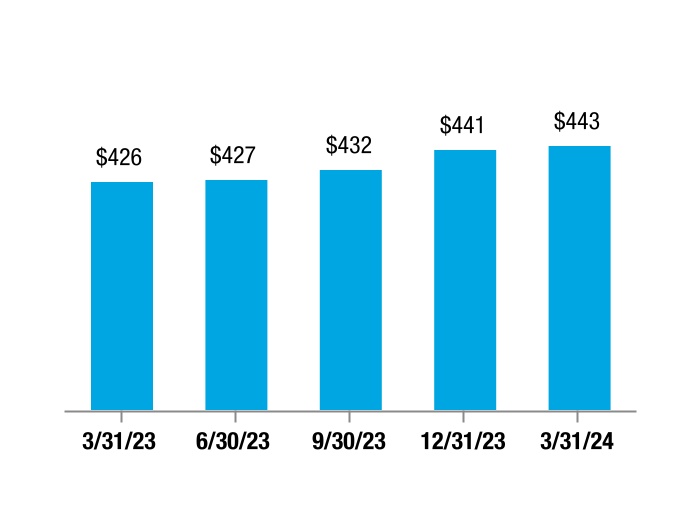
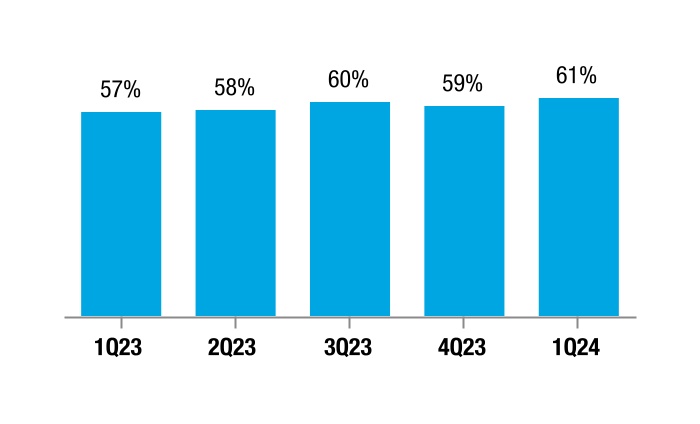
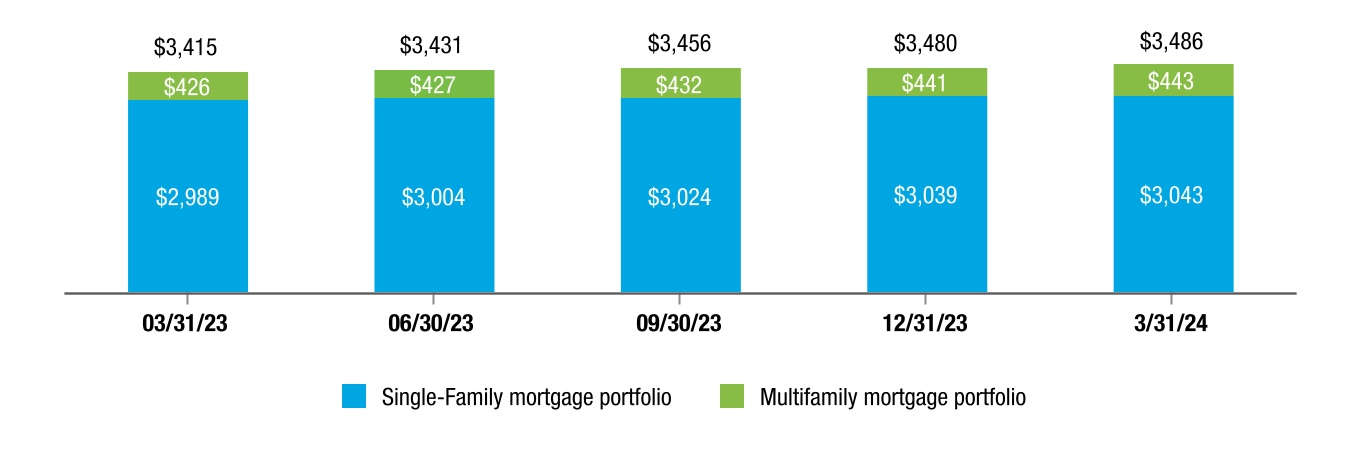
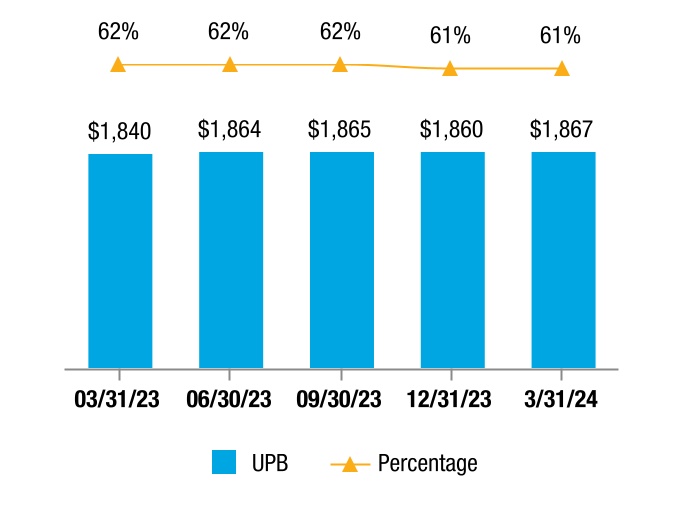
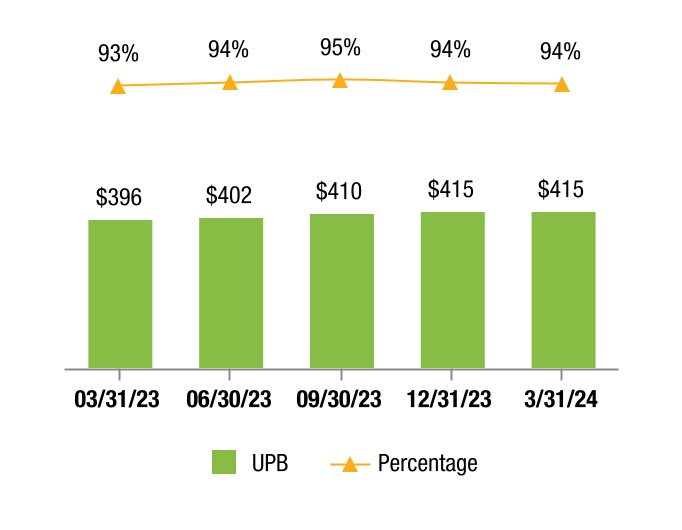
Management's Discussion and Analysis Introduction Mortgage Portfolio Balances Mortgage Portfolio (UPB in billions) Key Drivers: n Our mortgage portfolio increased 2% year-over-year to $3.5 trillion at March 31, 2024, continuing to grow at a moderate pace as new business activity remained low. l Our Single-Family mortgage portfolio was $3.0 trillion at March 31, 2024, up 2% year-over-year. l Our Multifamily mortgage portfolio was $443 billion at March 31, 2024, up 4% year-over-year. Credit Enhancement Coverage Single-Family Mortgage Portfolio with Credit Enhancement (UPB in billions) Multifamily Mortgage Portfolio with Credit Enhancement (UPB in billions) In addition to transferring interest-rate and liquidity risk to third-party investors through our securitization activities, we engage in various types of credit enhancements, such as primary mortgage insurance and CRT transactions, to reduce our credit risk exposure and transfer a portion of the credit risk on certain loans in our mortgage portfolio to third parties. At March 31, 2024, we had credit enhancement coverage of 61% on our Single-Family mortgage portfolio and 94% on our Multifamily mortgage portfolio. See MD&A - Risk Management – Credit Risk for additional information on our credit enhancements. Freddie Mac 1Q 2024 Form 10-Q 3
Management's Discussion and Analysis Housing and Mortgage Market Conditions
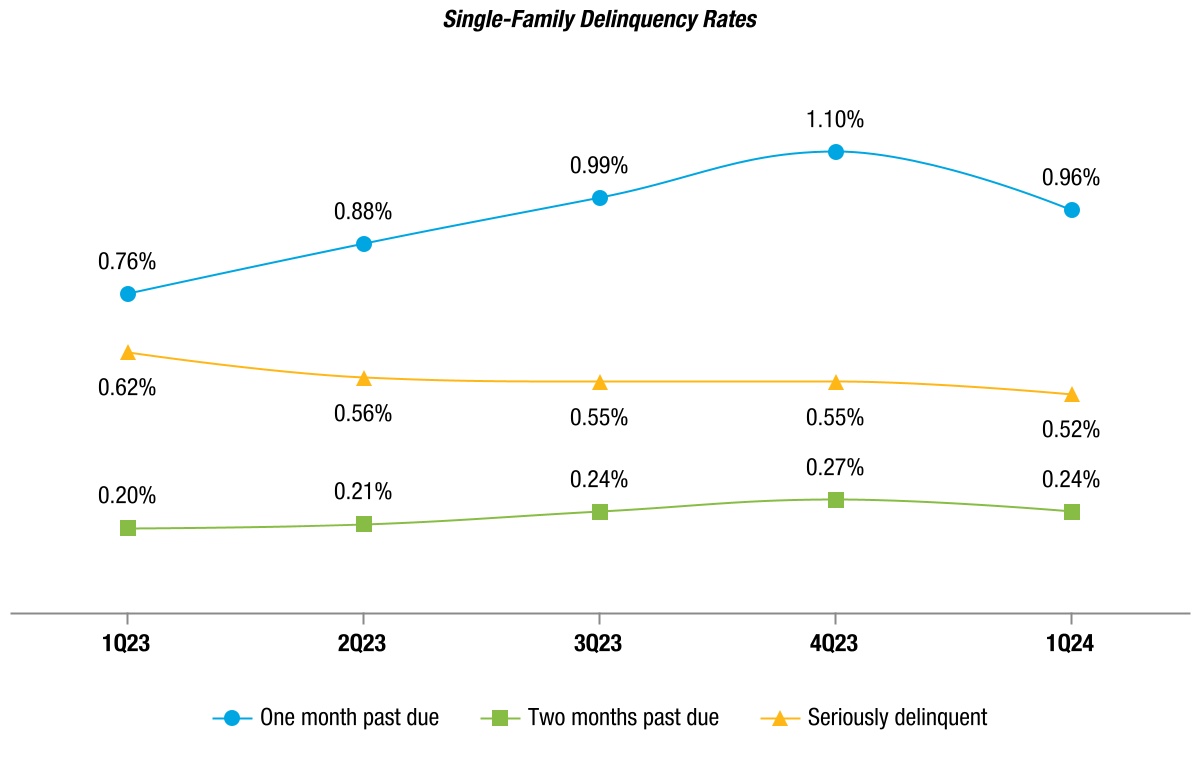
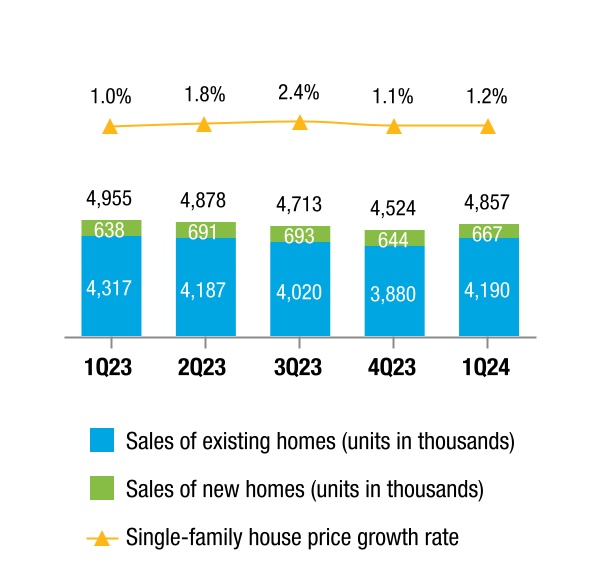
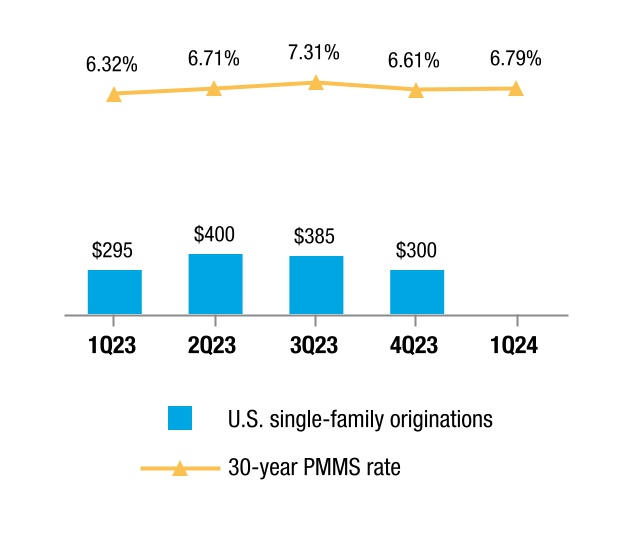
Management's Discussion and Analysis Housing and Mortgage Market Conditions HOUSING AND MORTGAGE MARKET CONDITIONS The following charts present certain housing and mortgage market indicators that can significantly affect our business and financial results. Certain market and macroeconomic prior period data have been updated to reflect revised historical data. For additional information on the effect of these indicators on our business and financial results, see MD&A – Consolidated Results of Operations and MD&A – Our Business Segments . Single-Family U.S. Single-Family Home Sales and House Prices Sources: National Association of Realtors, U.S. Census Bureau, and Freddie Mac House Price Index (seasonally adjusted rate). U.S. Single-Family Mortgage Originations _ (UPB in billions) Source: Freddie Mac and Inside Mortgage Finance. The 1Q 2024 U.S. single-family mortgage originations data is not yet available. Single-Family Serious Delinquency Rates Source: Freddie Mac and National Delinquency Survey from the Mortgage Bankers Association. The 1Q 2024 total mortgage market rate is not yet available. Single-Family Mortgage Debt Outstanding (UPB in trillions) Source: Freddie Mac and Federal Reserve Financial Accounts of the United States of America. The 1Q 2024 U.S. single-family mortgage debt outstanding balance is not yet available. Freddie Mac 1Q 2024 Form 10-Q 4
Management's Discussion and Analysis Housing and Mortgage Market Conditions
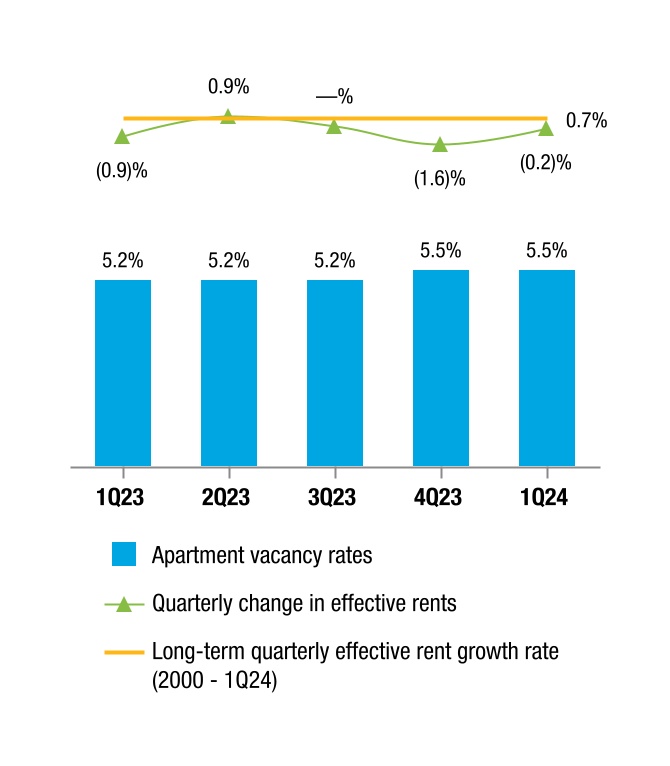
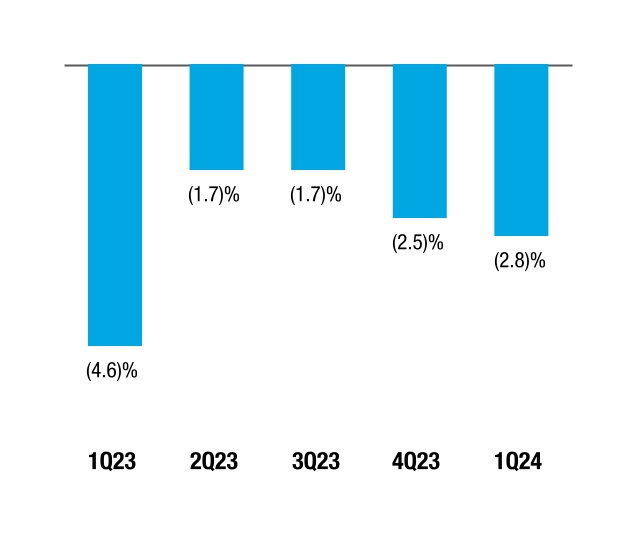
Management's Discussion and Analysis Housing and Mortgage Market Conditions Multifamily Apartment Vacancy Rates and Change in Effective Rents Source: Reis. Multifamily Property Price Growth Rate Source: Real Capital Analytics Commercial Property Price Index (RCA CPPI). Multifamily Delinquency Rates Source: Freddie Mac, FDIC Quarterly Banking Profile, Intex Solutions, Inc., and Wells Fargo Securities (Multifamily CMBS conduit market, excluding REOs). The 1Q 2024 delinquency rate for FDIC insured institutions is not yet available. Multifamily Mortgage Debt Outstanding (UPB in billions) Source: Freddie Mac and Federal Reserve Financial Accounts of the United States of America. The 1Q 2024 U.S. multifamily mortgage debt outstanding balance is not yet available. Freddie Mac 1Q 2024 Form 10-Q 5
Management's Discussion and Analysis Consolidated Results of Operations
Management's Discussion and Analysis Consolidated Results of Operations CONSOLIDATED RESULTS OF OPERATIONS The discussion of our consolidated results of operations should be read in conjunction with our condensed consolidated financial statements and accompanying notes. The table below compares our summarized consolidated results of operations. Table 1 - Summary of Consolidated Statements of Income and Comprehensive Income Change (Dollars in millions) 1Q 2024 1Q 2023 $ % Net interest income $4,759 $4,501 $258 6 % Non-interest income 998 326 672 206 Net revenues 5,757 4,827 930 19 (Provision) benefit for credit losses (181) (395) 214 54 Non-interest expense (2,122) (1,932) (190) (10) Income before income tax expense 3,454 2,500 954 38 Income tax expense (688) (505) (183) (36) Net income 2,766 1,995 771 39 Other comprehensive income (loss), net of taxes and reclassification adjustments (25) 54 (79) (146) Comprehensive income $2,741 $2,049 $692 34 % Net Revenues Net Interest Income The table below presents the components of net interest income. Table 2 - Components of Net Interest Income Change (Dollars in millions) 1Q 2024 1Q 2023 $ % Guarantee net interest income: Contractual net interest income $3,772 $3,666 $106 3 % Deferred fee income 166 207 (41) (20) Total guarantee net interest income 3,938 3,873 65 2 Investments net interest income 1,514 1,432 82 6 Impact on net interest income from hedge accounting (693) (804) 111 14 Net interest income $4,759 $4,501 $258 6 % Key Drivers: n Guarantee net interest income l 1Q 2024 vs. 1Q 2023 - Increased primarily due to continued mortgage portfolio growth. n Investments net interest income l 1Q 2024 vs. 1Q 2023 - Increased primarily due to higher returns on securities purchased under agreements to resell as a result of higher short-term interest rates. n Impact on net interest income from hedge accounting l 1Q 2024 vs. 1Q 2023 - Expense decreased primarily due to lower interest expens
Management's Discussion and Analysis Consolidated Results of Operations
Management's Discussion and Analysis Consolidated Results of Operations Net Interest Yield Analysis The table below presents a yield analysis of interest-earning assets and interest-bearing liabilities. Table 3 - Analysis of Net Interest Yield 1Q 2024 1Q 2023 (Dollars in millions) Average Balance Interest Income (Expense) Average Rate Average Balance Interest Income (Expense) Average Rate Interest-earning assets: Cash and cash equivalents $12,141 $125 4.09 % $13,758 $121 3.51 % Securities purchased under agreements to resell 111,796 1,532 5.48 107,516 1,220 4.54 Investment securities 41,293 470 4.56 38,126 316 3.31 Mortgage loans (1) 3,100,111 26,229 3.38 3,042,128 23,304 3.06 Other assets 1,784 29 6.48 1,930 26 5.30 Total interest-earning assets 3,267,125 28,385 3.47 3,203,458 24,987 3.12 Interest-bearing liabilities: Debt of consolidated trusts 3,035,073 (21,122) (2.78) 2,975,417 (18,261) (2.45) Debt of Freddie Mac 180,850 (2,504) (5.53) 187,599 (2,225) (4.74) Total interest-bearing liabilities 3,215,923 (23,626) (2.94) 3,163,016 (20,486) (2.59) Impact of net non-interest-bearing funding 51,202 — 0.05 40,442 — 0.03 Total funding of interest-earning assets 3,267,125 (23,626) (2.89) 3,203,458 (20,486) (2.56) Net interest income/yield $4,759 0.58 % $4,501 0.56 % (1) Loan fees included in net interest income were $0.3 billion during both 1Q 2024 and 1Q 2023. Non-Interest Income The table below presents the components of non-interest income. Table 4 - Components of Non-Interest Income Change (Dollars in millions) 1Q 2024 1Q 2023 $ % Guarantee income $496 $466 $30 6 % Investment gains, net 405 (225) 630 280 Other income 97 85 12 14 Non-interest income $998 $326 $672 206 % Key Drivers: n Investment gains, net l 1Q 2024 vs. 1Q 2023 - Increased primarily due to gains in Multifamily driven by net gains from interest-rate risk management activities, higher revenues from held-for-sale loan purchase and securitization activi
Management's Discussion and Analysis Consolidated Results of Operations
Management's Discussion and Analysis Consolidated Results of Operations (Provision) Benefit for Credit Losses The table below presents the components of provision for credit losses. Table 5 - (Provision) Benefit for Credit Losses Change (Dollars in millions) 1Q 2024 1Q 2023 $ % Single-Family ($120) ($318) $198 62 % Multifamily (61) (77) 16 21 (Provision) benefit for credit losses ($181) ($395) $214 54 % Key Drivers: n 1Q 2024 vs. 1Q 2023 - The provision for credit losses for 1Q 2024 was primarily driven by a modest credit reserve build in Single-Family attributable to new acquisitions and increasing mortgage interest rates. The provision for credit losses for 1Q 2023 was driven by a modest credit reserve build primarily attributable to new acquisitions in Single-Family. Non-Interest Expense The table below presents the components of non-interest expense. Table 6 - Components of Non-Interest Expense Change (Dollars in millions) 1Q 2024 1Q 2023 $ % Salaries and employee benefits ($421) ($374) ($47) (13) % Credit enhancement expense (597) (530) (67) (13) Benefit for (decrease in) credit enhancement recoveries 1 49 (48) (98) Legislative assessments expense: Legislated guarantee fees expense (724) (708) (16) (2) Affordable housing funds allocation (30) (27) (3) (11) Total legislative assessments expense (754) (735) (19) (3) Other expense (351) (342) (9) (3) Non-interest expense ($2,122) ($1,932) ($190) (10) % Key Drivers: n Credit enhancement expense l 1Q 2024 vs. 1Q 2023 - Increased primarily due to expenses related to STACR Trust note repurchases in 1Q 2024. There were no STACR Trust note repurchases in 1Q 2023. n Benefit for (decrease in) credit enhancement recoveries l 1Q 2024 vs. 1Q 2023 - Decreased primarily due to a lower increase in expected credit losses on covered loans. Freddie Mac 1Q 2024 Form 10-Q 8
Management's Discussion and Analysis Consolidated Balance Sheets Analysis
Management's Discussion and Analysis Consolidated Balance Sheets Analysis CONSOLIDATED BALANCE SHEETS ANALYSIS The table below compares our summarized condensed consolidated balance sheets. Table 7 - Summarized Condensed Consolidated Balance Sheets Change (Dollars in millions) March 31, 2024 December 31, 2023 $ % Assets: Cash and cash equivalents $3,531 $6,019 ($2,488) (41) % Securities purchased under agreements to resell 102,257 95,148 7,109 7 Investment securities, at fair value 41,400 43,275 (1,875) (4) Mortgage loans held-for-sale 12,034 12,941 (907) (7) Mortgage loans held-for-investment 3,088,687 3,083,665 5,022 — Accrued interest receivable, net 10,047 9,925 122 1 Deferred tax assets, net 4,227 4,076 151 4 Other assets 25,190 25,927 (737) (3) Total assets $3,287,373 $3,280,976 $6,397 — % Liabilities and Equity: Liabilities: Accrued interest payable $8,712 $8,812 ($100) (1) % Debt 3,211,742 3,208,346 3,396 — Other liabilities 16,456 16,096 360 2 Total liabilities 3,236,910 3,233,254 3,656 — Total equity 50,463 47,722 2,741 6 Total liabilities and equity $3,287,373 $3,280,976 $6,397 — % Key Drivers: As of March 31, 2024 compared to December 31, 2023: n Securities purchased under agreements to resell increased primarily due to investment of retained earnings and a shift from cash and cash equivalents and Treasury securities to securities purchased under agreements to resell. n Mortgage loans held-for-investment increased primarily due to growth in our Single-Family mortgage portfolio. n Debt increased due to an increase in debt of consolidated trusts driven by growth in our Single-Family mortgage portfolio. Freddie Mac 1Q 2024 Form 10-Q 9
Management's Discussion and Analysis Our Portfolios
Management's Discussion and Analysis Our Portfolios OUR PORTFOLIOS Mortgage Portfolio The table below presents the UPB of our mortgage portfolio by segment. Table 8 - Mortgage Portfolio March 31, 2024 December 31, 2023 (In millions) Single-Family Multifamily Total Single-Family Multifamily Total Mortgage loans held-for-investment: By consolidated trusts $2,965,370 $51,757 $3,017,127 $2,963,296 $47,433 $3,010,729 By Freddie Mac 35,643 10,000 45,643 33,213 11,770 44,983 Total mortgage loans held-for-investment 3,001,013 61,757 3,062,770 2,996,509 59,203 3,055,712 Mortgage loans held-for-sale 3,104 9,446 12,550 3,527 9,905 13,432 Total mortgage loans 3,004,117 71,203 3,075,320 3,000,036 69,108 3,069,144 Mortgage-related guarantees: Mortgage loans held by nonconsolidated trusts 30,324 361,164 391,488 30,182 360,928 391,110 Other mortgage-related guarantees 8,511 10,720 19,231 8,692 10,761 19,453 Total mortgage-related guarantees 38,835 371,884 410,719 38,874 371,689 410,563 Total mortgage portfolio $3,042,952 $443,087 $3,486,039 $3,038,910 $440,797 $3,479,707 Guaranteed mortgage-related securities: Issued by consolidated trusts $2,975,161 $51,811 $3,026,972 $2,970,707 $47,436 $3,018,143 Issued by nonconsolidated trusts 24,762 321,905 346,667 24,600 321,262 345,862 Total guaranteed mortgage-related securities $2,999,923 $373,716 $3,373,639 $2,995,307 $368,698 $3,364,005 Investments Portfolio Our investments portfolio consists of our mortgage-related investments portfolio and our other investments portfolio. Mortgage-Related Investments Portfolio The Purchase Agreement limits the size of our mortgage-related investments portfolio to a maximum amount of $225 billion. The calculation of mortgage assets subject to the Purchase Agreement cap includes the UPB of mortgage assets and 10% of the notional value of interest-only securities. We are also subject to additional limitations on the size and composition of our mortgage-related investments
Management's Discussion and Analysis Our Portfolios
Management's Discussion and Analysis Our Portfolios The table below presents the details of our mortgage-related investments portfolio. Table 9 - Mortgage-Related Investments Portfolio March 31, 2024 December 31, 2023 (In millions) Single-Family Multifamily Total Single-Family Multifamily Total Unsecuritized mortgage loans: Securitization pipeline loans (1) $9,749 $13,057 $22,806 $8,225 $15,197 $23,422 Other loans (2) 28,998 6,389 35,387 28,515 6,478 34,993 Total unsecuritized mortgage loans 38,747 19,446 58,193 36,740 21,675 58,415 Mortgage-related securities: Investment securities 2,916 4,486 7,402 2,667 4,613 7,280 Debt of consolidated trusts 18,367 684 19,051 18,639 660 19,299 Total mortgage-related securities 21,283 5,170 26,453 21,306 5,273 26,579 Mortgage-related investments portfolio $60,030 $24,616 $84,646 $58,046 $26,948 $84,994 10% of notional amount of interest-only securities $23,126 $22,186 Mortgage-related investments portfolio for purposes of Purchase Agreement cap 107,772 107,180 (1) Single-family and multifamily loans that we have purchased for cash and aggregate on our balance sheet for securitization within the normal course of business. (2) Primarily includes delinquent and modified single-family loans that we have purchased from securitization trusts. Other Investments Portfolio The table below presents the details of our other investments portfolio. Table 10 - Other Investments Portfolio March 31, 2024 December 31, 2023 (In millions) Liquidity and Contingency Operating Portfolio Custodial Account Other Total Other Investments Portfolio (1) Liquidity and Contingency Operating Portfolio Custodial Account Other Total Other Investments Portfolio (1) Cash and cash equivalents $1,947 $1,483 $101 $3,531 $5,041 $890 $88 $6,019 Securities purchased under agreements to resell 104,243 10,777 1,037 116,057 94,904 9,396 1,093 105,393 Non-mortgage related securities (2) 22,960 — 5,593 28,553 24,153 — 6,119 30,272 Othe
Management's Discussion and Analysis Our Business Segments
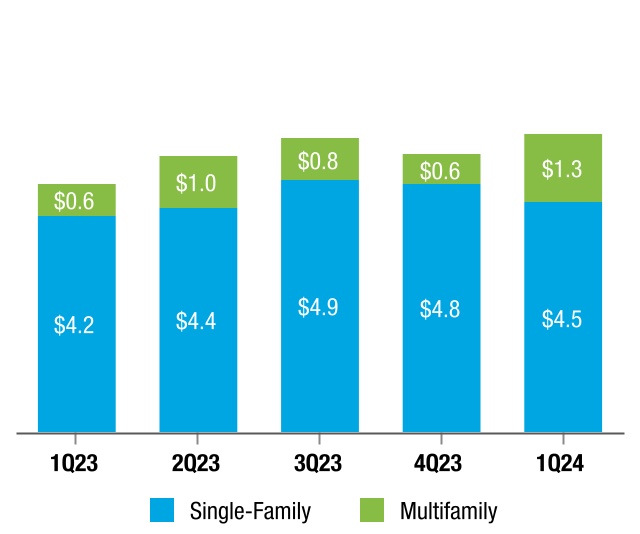
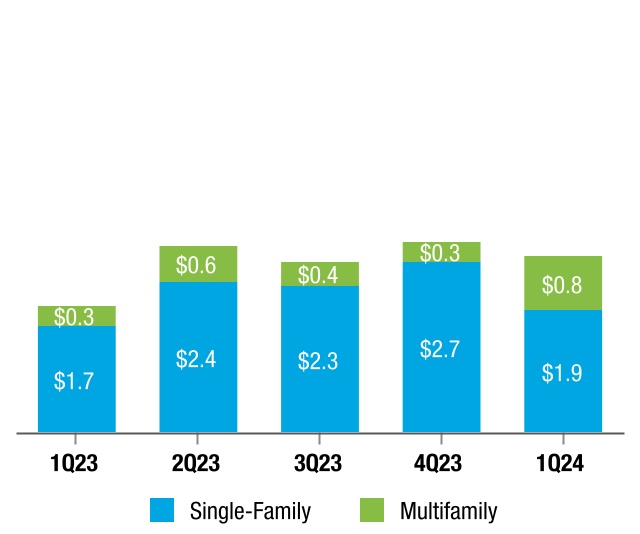
Management's Discussion and Analysis Our Business Segments OUR BUSINESS SEGMENTS As shown in the table below, we have two reportable segments, which are based on the way we manage our business. Segment Description Single-Family Reflects results from our purchase, securitization, and guarantee of single-family loans, our investments in single-family loans and mortgage-related securities, the management of Single-Family mortgage credit risk and market risk, and any results of our treasury function that are not allocated to each segment. Multifamily Reflects results from our purchase, securitization, and guarantee of multifamily loans, our investments in multifamily loans and mortgage-related securities, and the management of Multifamily mortgage credit risk and market risk. Segment Net Revenues and Net Income The charts below show our net revenues and net income by segment. Segment Net Revenues (In billions) Segment Net Income (In billions) Freddie Mac 1Q 2024 Form 10-Q 12
Management's Discussion and Analysis Our Business Segments | Single-Family
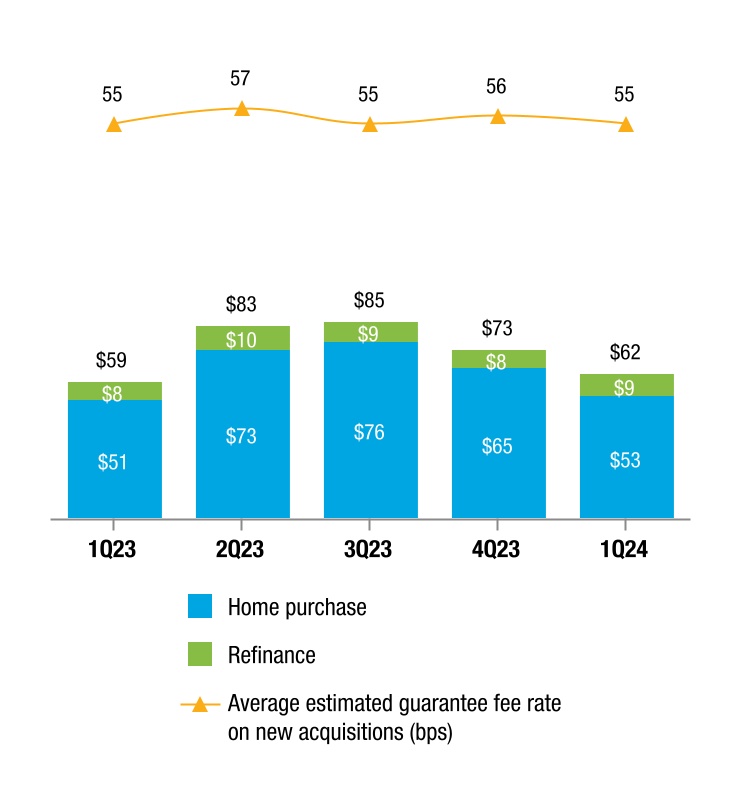
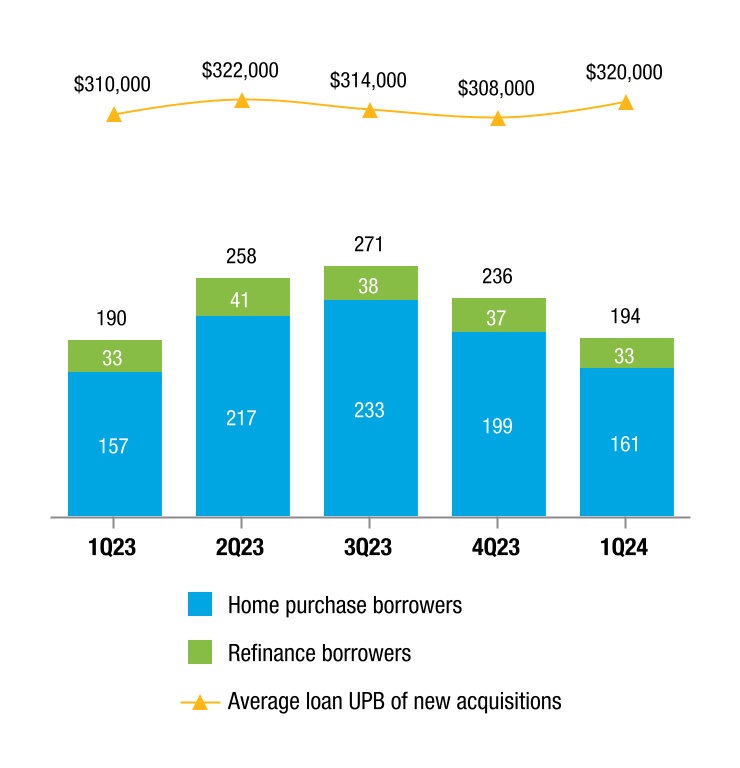
Management's Discussion and Analysis Our Business Segments | Single-Family Single-Family Business Results The charts, tables, and related discussion below present the business results of our Single-Family segment. New Business Activity UPB of Single-Family Loan Purchases and Guarantees by Loan Purpose and Average Estimated Guarantee Fee Rate (1) on New Acquisitions (UPB in billions) (1) Estimated guarantee fee rate calculation excludes the legislated guarantee fees and includes deferred fees recognized over the estimated life of the related loans. Number of Families Helped to Own a Home and Average Loan UPB of New Acquisitions (Loan count in thousands) n 1Q 2024 vs. 1Q 2023 l Our loan purchase and guarantee activity increased from $59 billion to $62 billion. l The average loan size of new acquisitions increased due to a higher conforming loan limit and house price appreciation in recent quarters. l The average estimated guarantee fee rate on new acquisitions remained at 55 bps. Freddie Mac 1Q 2024 Form 10-Q 13
Management's Discussion and Analysis Our Business Segments | Single-Family
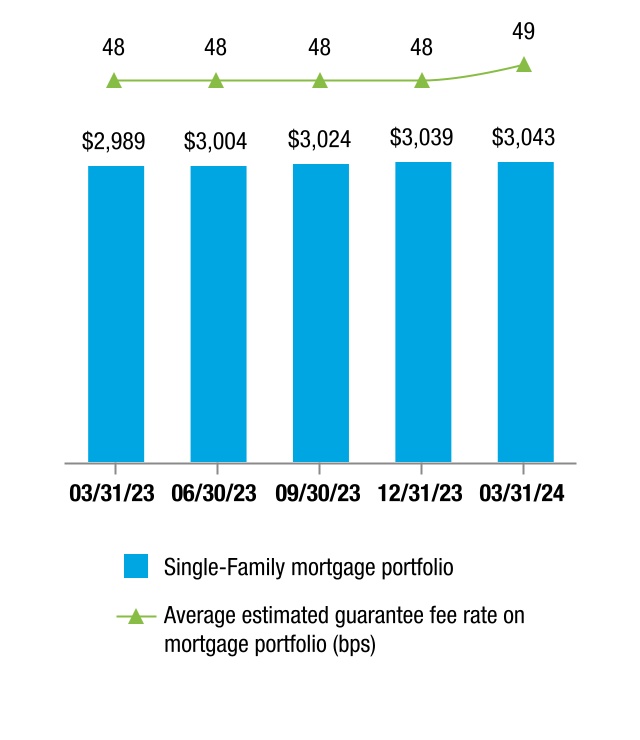
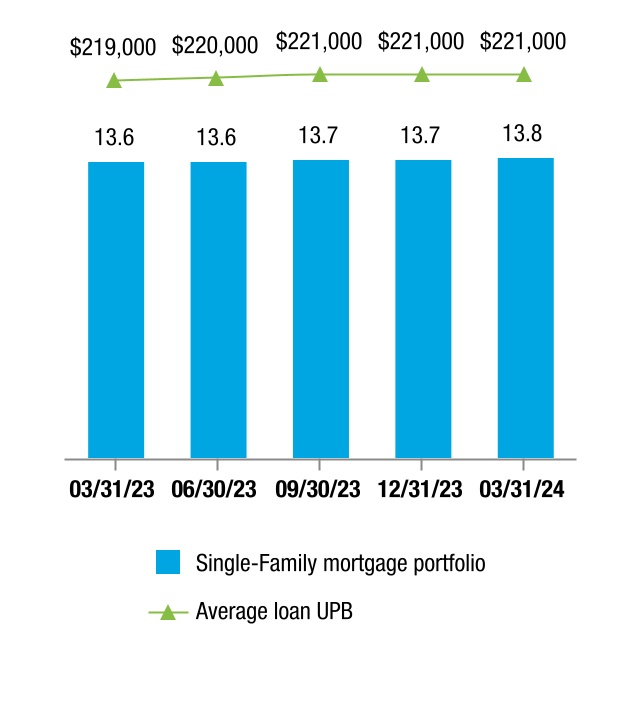
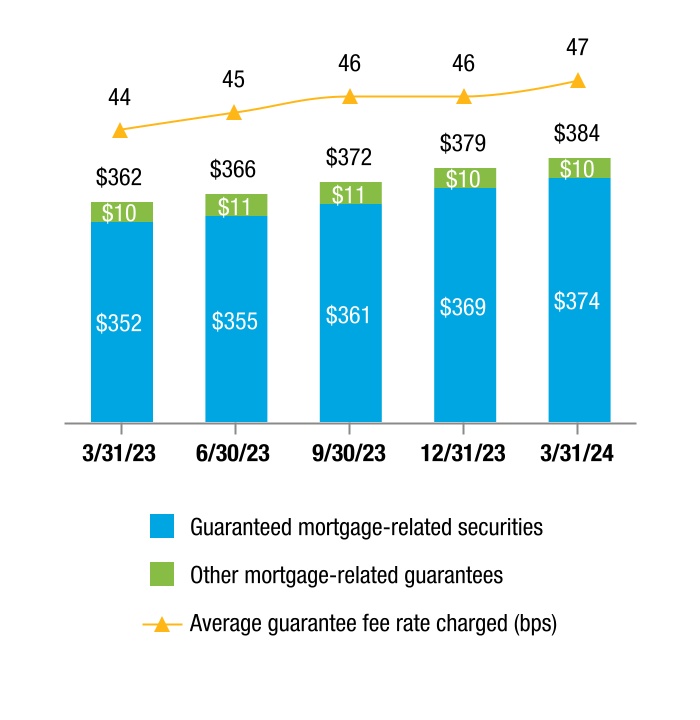
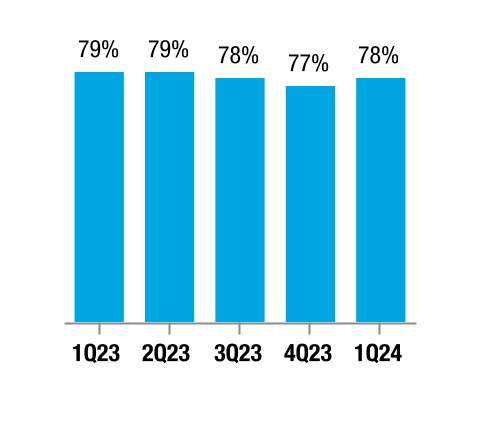
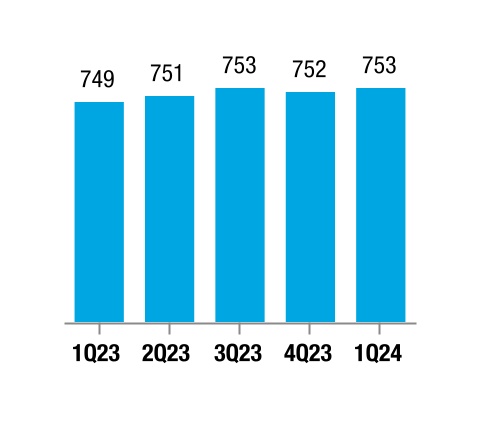
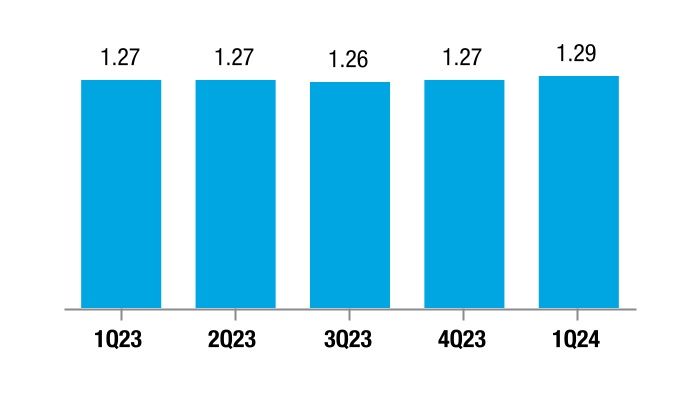
Management's Discussion and Analysis Our Business Segments | Single-Family Single-Family Mortgage Portfolio Single-Family Mortgage Portfolio and Average Estimated Guarantee Fee Rate (1) on Mortgage Portfolio (UPB in billions) (1) Estimated guarantee fee rate is calculated as of acquisition and includes deferred fees recognized over the estimated life of the related loans. Estimated guarantee fee rate calculation excludes the legislated guarantee fees and certain loans, the majority of which are held by VIEs that we do not consolidate. The UPB of these excluded loans was $41 billion as of March 31, 2024. Single-Family Mortgage Loans (Loan count in millions) n Our Single-Family mortgage portfolio was $3.0 trillion at March 31, 2024, up 2% year-over-year. The mortgage portfolio continued to grow at a moderate pace as new business activity remained low. n The average estimated guarantee fee rate on our Single-Family mortgage portfolio increased slightly year-over-year. Freddie Mac 1Q 2024 Form 10-Q 14
Management's Discussion and Analysis Our Business Segments | Single-Family
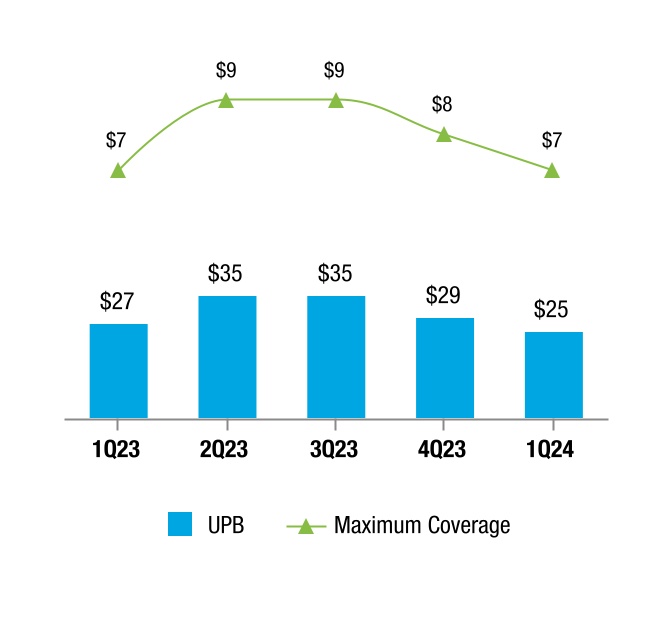
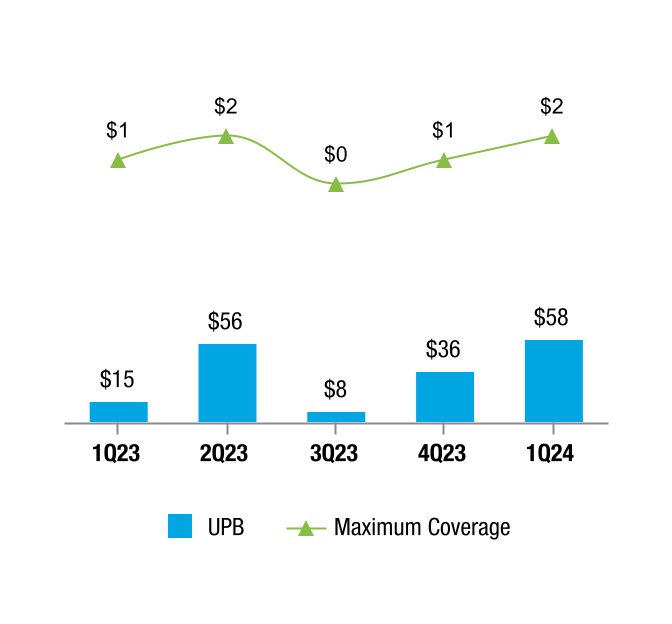
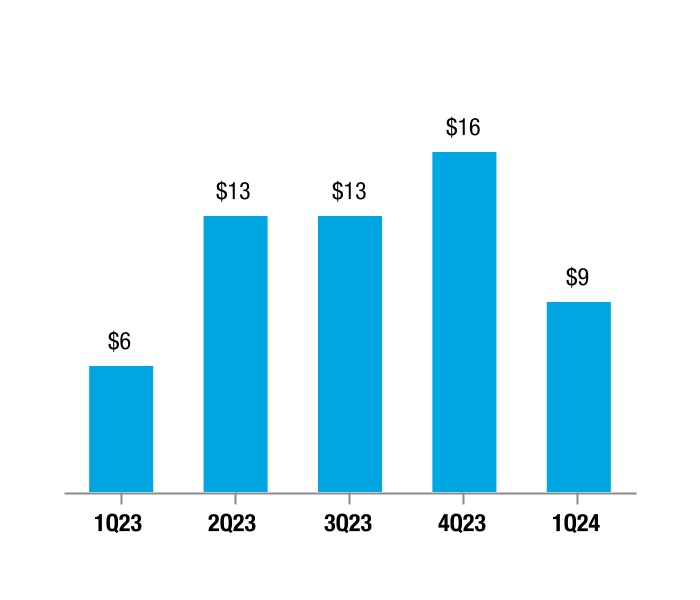
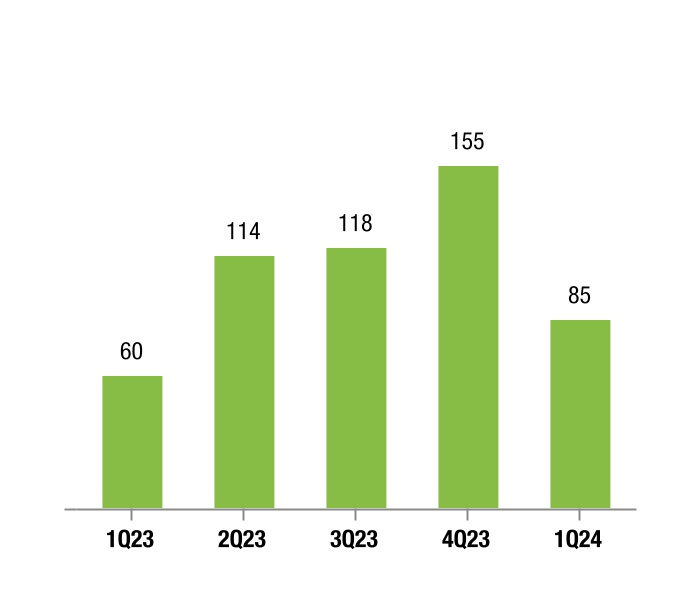
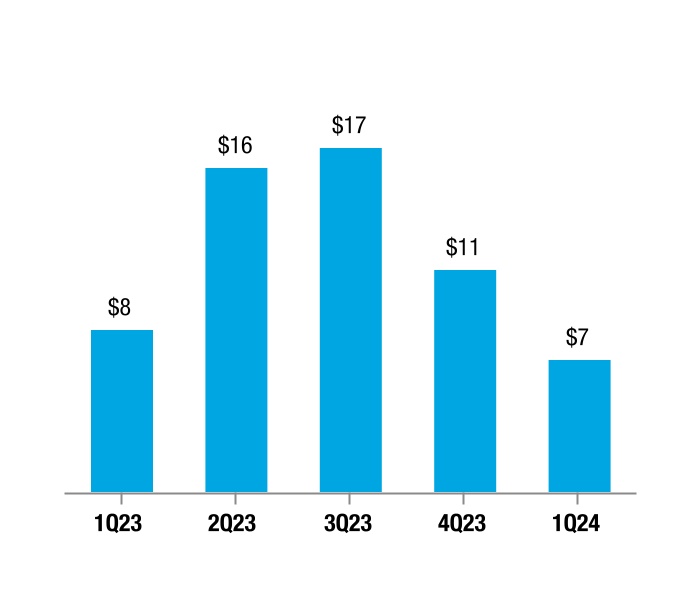
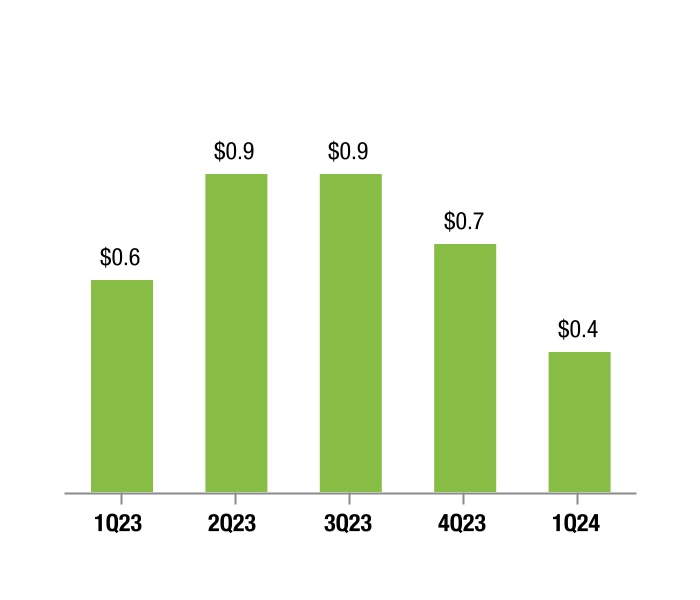
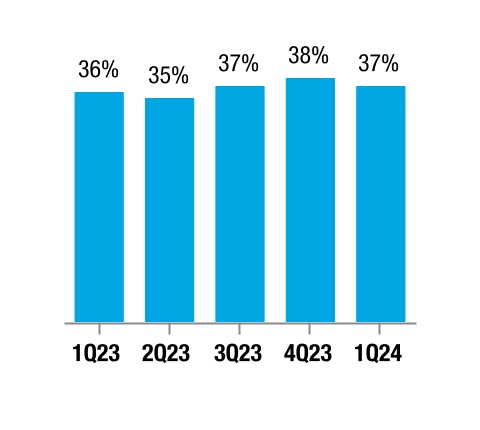
Management's Discussion and Analysis Our Business Segments | Single-Family Credit Enhancements We obtain credit enhancements on a portion of our Single-Family mortgage portfolio to reduce the risk of future losses to us when borrowers default. The charts below provide the UPB of the mortgage loans acquired during the periods presented that were covered by primary mortgage insurance, the UPB of the mortgage loans covered by CRT transactions issued during the periods presented, and maximum coverage related to these credit enhancements. The primary mortgage insurance and CRT activities presented in these charts are not mutua