FMCC Files Q2 2024 10-Q: Financials Revealed
Ticker: FMCKK · Form: 10-Q · Filed: Jul 31, 2024 · CIK: 1026214
| Field | Detail |
|---|---|
| Company | Federal Home Loan Mortgage Corp (FMCKK) |
| Form Type | 10-Q |
| Filed Date | Jul 31, 2024 |
| Risk Level | medium |
| Pages | 15 |
| Reading Time | 18 min |
| Key Dollar Amounts | $2.8 b, $6.0 b, $53.2 billion, $42.0 billion, $123.1 billion |
| Sentiment | neutral |
Sentiment: neutral
Topics: mortgage, financials, 10-Q, housing
Related Tickers: FNMA
TL;DR
**FMCC Q2 2024 10-Q is IN! 📊 Check financials for mortgage market pulse.**
AI Summary
Federal Home Loan Mortgage Corp (FMCC) filed its 10-Q for the period ending June 30, 2024. The filing details the company's financial performance and position, including its assets, liabilities, and equity. Specific financial figures and operational details for the second quarter of 2024 are presented, reflecting the company's ongoing activities in the mortgage market.
Why It Matters
This filing provides crucial insights into the financial health and operational performance of a major player in the US housing finance system, impacting mortgage availability and rates.
Risk Assessment
Risk Level: medium — As a federally sponsored enterprise involved in the mortgage market, FMCC faces inherent risks related to interest rate fluctuations, credit defaults, and regulatory changes.
Key Numbers
- 20240630 — Reporting Period End Date (Indicates the end of the fiscal quarter for which financial data is reported.)
- 20240731 — Filing Date (The date the 10-Q report was officially submitted to the SEC.)
Key Players & Entities
- FEDERAL HOME LOAN MORTGAGE CORP (company) — Filer of the 10-Q
- 0001026214 (company) — Central Index Key for FMCC
- 20240630 (date) — End of the reporting period
- 20240731 (date) — Filing date
- 7039032000 (dollar_amount) — Business phone number
FAQ
What is the reporting period for this 10-Q filing?
The reporting period for this 10-Q filing is the quarter ended June 30, 2024.
What is the Central Index Key (CIK) for Federal Home Loan Mortgage Corp?
The Central Index Key for Federal Home Loan Mortgage Corp is 0001026214.
When was this 10-Q filing submitted to the SEC?
This 10-Q filing was submitted to the SEC on July 31, 2024.
What is the company's fiscal year end?
The company's fiscal year end is December 31.
What is the business address of Federal Home Loan Mortgage Corp?
The business address is 8200 Jones Branch Dr, McLean, VA 22102.
Filing Stats: 4,397 words · 18 min read · ~15 pages · Grade level 13.9 · Accepted 2024-07-31 07:59:07
Key Financial Figures
- $2.8 b — lions) Key Drivers: n Net income was $2.8 billion, a decrease of 6% year-over-year,
- $6.0 b — gher net revenues. n Net revenues were $6.0 billion, an increase of 12% year-over-yea
- $53.2 billion — r non-interest income. n Net worth was $53.2 billion as of June 30, 2024, up from $42.0 bill
- $42.0 billion — .2 billion as of June 30, 2024, up from $42.0 billion as of June 30, 2023. The quarterly incr
- $123.1 billion — rence of the senior preferred stock was $123.1 billion on June 30, 2024, and will increase to
- $125.9 billion — on June 30, 2024, and will increase to $125.9 billion on September 30, 2024 based on the incr
- $96 billion — well as for rental housing. We provided $96 billion in liquidity to the mortgage market in
- $3.5 — ortfolio increased 2% year-over-year to $3.5 trillion at June 30, 2024, continuing t
- $3.1 — ur Single-Family mortgage portfolio was $3.1 trillion at June 30, 2024, up 2% year-o
- $447 billion — Our Multifamily mortgage portfolio was $447 billion at June 30, 2024, up 5% year-over-year.
- $4,928 — YTD 2023 $ % (1) Net interest income $4,928 $4,523 $405 9 % $9,687 $9,024 $663 7 %
- $4,523 — 23 $ % (1) Net interest income $4,928 $4,523 $405 9 % $9,687 $9,024 $663 7 % Non-in
- $405 — (1) Net interest income $4,928 $4,523 $405 9 % $9,687 $9,024 $663 7 % Non-interes
- $9,687 — interest income $4,928 $4,523 $405 9 % $9,687 $9,024 $663 7 % Non-interest income 1,
- $9,024 — st income $4,928 $4,523 $405 9 % $9,687 $9,024 $663 7 % Non-interest income 1,060 816
Filing Documents
- fmcc-20240630.htm (10-Q) — 5053KB
- a2q2410qex311.htm (EX-31.1) — 19KB
- a2q2410qex312.htm (EX-31.2) — 18KB
- a2q2410qex321.htm (EX-32.1) — 7KB
- a2q2410qex322.htm (EX-32.2) — 7KB
- fmcc-20240630_g1.jpg (GRAPHIC) — 14KB
- fmcc-20240630_g10.jpg (GRAPHIC) — 36KB
- fmcc-20240630_g11.jpg (GRAPHIC) — 51KB
- fmcc-20240630_g12.jpg (GRAPHIC) — 63KB
- fmcc-20240630_g13.jpg (GRAPHIC) — 23KB
- fmcc-20240630_g14.jpg (GRAPHIC) — 61KB
- fmcc-20240630_g15.jpg (GRAPHIC) — 53KB
- fmcc-20240630_g16.jpg (GRAPHIC) — 50KB
- fmcc-20240630_g17.jpg (GRAPHIC) — 48KB
- fmcc-20240630_g18.jpg (GRAPHIC) — 76KB
- fmcc-20240630_g19.jpg (GRAPHIC) — 77KB
- fmcc-20240630_g2.jpg (GRAPHIC) — 41KB
- fmcc-20240630_g20.jpg (GRAPHIC) — 65KB
- fmcc-20240630_g21.jpg (GRAPHIC) — 59KB
- fmcc-20240630_g22.jpg (GRAPHIC) — 45KB
- fmcc-20240630_g23.jpg (GRAPHIC) — 44KB
- fmcc-20240630_g24.jpg (GRAPHIC) — 35KB
- fmcc-20240630_g25.jpg (GRAPHIC) — 34KB
- fmcc-20240630_g26.jpg (GRAPHIC) — 34KB
- fmcc-20240630_g27.jpg (GRAPHIC) — 75KB
- fmcc-20240630_g28.jpg (GRAPHIC) — 36KB
- fmcc-20240630_g29.jpg (GRAPHIC) — 35KB
- fmcc-20240630_g3.jpg (GRAPHIC) — 33KB
- fmcc-20240630_g30.jpg (GRAPHIC) — 31KB
- fmcc-20240630_g31.jpg (GRAPHIC) — 30KB
- fmcc-20240630_g32.jpg (GRAPHIC) — 33KB
- fmcc-20240630_g33.jpg (GRAPHIC) — 82KB
- fmcc-20240630_g34.jpg (GRAPHIC) — 36KB
- fmcc-20240630_g35.jpg (GRAPHIC) — 35KB
- fmcc-20240630_g36.jpg (GRAPHIC) — 66KB
- fmcc-20240630_g37.jpg (GRAPHIC) — 52KB
- fmcc-20240630_g4.jpg (GRAPHIC) — 62KB
- fmcc-20240630_g5.jpg (GRAPHIC) — 68KB
- fmcc-20240630_g6.jpg (GRAPHIC) — 46KB
- fmcc-20240630_g7.jpg (GRAPHIC) — 42KB
- fmcc-20240630_g8.jpg (GRAPHIC) — 64KB
- fmcc-20240630_g9.jpg (GRAPHIC) — 42KB
- 0001026214-24-000068.txt ( ) — 27469KB
- fmcc-20240630.xsd (EX-101.SCH) — 92KB
- fmcc-20240630_cal.xml (EX-101.CAL) — 81KB
- fmcc-20240630_def.xml (EX-101.DEF) — 672KB
- fmcc-20240630_lab.xml (EX-101.LAB) — 1025KB
- fmcc-20240630_pre.xml (EX-101.PRE) — 848KB
- fmcc-20240630_htm.xml (XML) — 6069KB
MANAGEMENT'S DISCUSSION AND ANALYSIS OF FINANCIAL CONDITION AND RESULTS OF OPERATIONS 1
MANAGEMENT'S DISCUSSION AND ANALYSIS OF FINANCIAL CONDITION AND RESULTS OF OPERATIONS 1 n Introduction 1 n Housing and Mortgage Market Conditions 4 n Consolidated Results of Operations 6 n Consolidated Balance Sheets Analysis 10 n Our Portfolios 11 n Our Business Segments 13 n Risk Management 22 l Credit Risk 22 l Market Risk 31 n Liquidity and Capital Resources 34 n Critical Accounting Estimates 42 n Regulation and Supervision 43 n Forward-Looking Statements 45
FINANCIAL STATEMENTS 47
FINANCIAL STATEMENTS 47 OTHER INFORMATION 96
CONTROLS AND PROCEDURES 98
CONTROLS AND PROCEDURES 98 EXHIBIT INDEX 99 SIGNATURES 100 FORM 10-Q INDEX 101 Freddie Mac 2Q 2024 Form 10-Q i Table of Contents MD&A TABLE INDEX Table Description Page 1 Summary of Consolidated Statements of Income and Comprehensive Income 6 2 Components of Net Interest Income 6 3 Analysis of Net Interest Yield 7 4 Components of Non-Interest Income 8 5 (Provision) Benefit for Credit Losses 8 6 Components of Non-Interest Expense 9 7 Summarized Condensed Consolidated Balance Sheets 10 8 Mortgage Portfolio 11 9 Mortgage-Related Investments Portfolio 12 10 Other Investments Portfolio 12 11 Single-Family Segment Financial Results 17 12 Multifamily Segment Financial Results 21 13 Allowance for Credit Losses Activity 22 14 Allowance for Credit Losses Ratios 23 15 Single-Family New Business Activity 24 16 Single-Family Mortgage Portfolio Newly Acquired Credit Enhancements 24 17 Single-Family Mortgage Portfolio Credit Enhancement Coverage Outstanding 25 18 Serious Delinquency Rates for Credit-Enhanced and Non-Credit-Enhanced Loans in Our Single-Family Mortgage Portfolio 26 19 Credit Quality Characteristics of Our Single-Family Mortgage Portfolio 26 20 Single-Family Mortgage Portfolio Attribute Combinations 27 21 Single-Family Completed Loan Workout Activity 29 22 Multifamily Mortgage Portfolio CRT Issuance 30 23 Credit-Enhanced and Non-Credit-Enhanced Loans Underlying Our Multifamily Mortgage Portfolio 31 24 Credit Quality of Our Multifamily Mortgage Portfolio Without Credit Enhancement 31 25 PVS-YC and PVS-L Results Assuming Shifts of the Yield Curve 32 26 Duration Gap and PVS Results 32 27 PVS-L Results Before Derivatives and After Derivatives 32 28 Earnings Sensitivity to Changes in Interest Rates 33 29 Liquidity Sources 34 30 Funding Sources 35 31 Debt of Freddie Mac Activity 35 32 Maturity and Redemption Dates 36 33 Debt of Consolidated Trusts Activity 37 34 Net Worth Activity 38 35 Regu
Management's Discussion and Analysis Introduction
Management's Discussion and Analysis Introduction
Management's Discussion and Analysis of Financial Condition and Results of Operations
Management's Discussion and Analysis of Financial Condition and Results of Operations This Quarterly Report on Form 10-Q includes forward-looking statements that are based on current expectations and that are subject to significant risks and uncertainties. These forward-looking statements are made as of the date of this Form 10-Q. We undertake no obligation to update any forward-looking statement to reflect events or circumstances after the date of this Form 10-Q. Actual results might differ significantly from those described in or implied by such statements due to various factors and uncertainties, including those described in the MD&A - Forward-Looking Statements section of this Form 10-Q and the Introduction and Risk Factors sections of our Annual Report on Form 10-K for the year ended December 31, 2023, or 2023 Annual Report. Throughout this Form 10-Q, we use certain acronyms and terms that are defined in the Glossary of our 2023 Annual Report. You should read the following MD&A in conjunction with our 2023 Annual Report and our condensed consolidated financial statements and accompanying notes for the three and six months ended June 30, 2024 included in Financial Statements . INTRODUCTION Freddie Mac is a GSE chartered by Congress in 1970, with a mission to provide liquidity, stability, and affordability to the U.S. housing market. We do this primarily by purchasing single-family and multifamily residential mortgage loans originated by lenders. In most instances, we package these loans into guaranteed mortgage-related securities, which are sold in the global capital markets, and transfer interest-rate and liquidity risks to third-party investors. In addition, we transfer a portion of our mortgage credit risk exposure to third-party investors through our credit risk transfer programs, which include securities- and insurance-based offerings. We also invest in mortgage loans, mortgage-related securities, and other types of assets. We do not originate mortgag
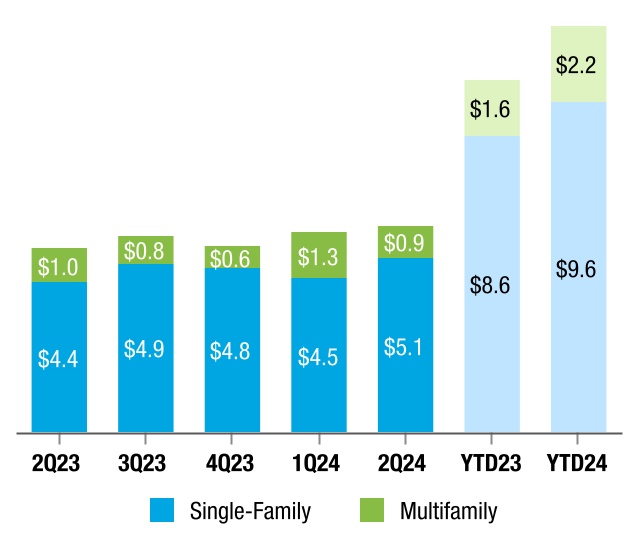
Management's Discussion and Analysis Introduction
Management's Discussion and Analysis Introduction Business Results Consolidated Financial Results Net Revenues and Net Income (In billions) Net Worth (In billions) Key Drivers: n Net income was $2.8 billion, a decrease of 6% year-over-year, primarily driven by a credit reserve build in the current period compared to a credit reserve release in the prior year period, partially offset by higher net revenues. n Net revenues were $6.0 billion, an increase of 12% year-over-year, driven by higher net interest income and higher non-interest income. n Net worth was $53.2 billion as of June 30, 2024, up from $42.0 billion as of June 30, 2023. The quarterly increases in net worth have been, or will be, added to the aggregate liquidation preference of the senior preferred stock. The liquidation preference of the senior preferred stock was $123.1 billion on June 30, 2024, and will increase to $125.9 billion on September 30, 2024 based on the increase in net worth in 2Q 2024. Market Liquidity Market Liquidity (In thousands) We support the U.S. housing market by executing our mission to provide liquidity and help maintain credit availability for new and refinanced single-family mortgages as well as for rental housing. We provided $96 billion in liquidity to the mortgage market in 2Q 2024, which enabled the financing of 349,000 home purchases, refinancings, and rental units. Freddie Mac 2Q 2024 Form 10-Q 2
Management's Discussion and Analysis Introduction
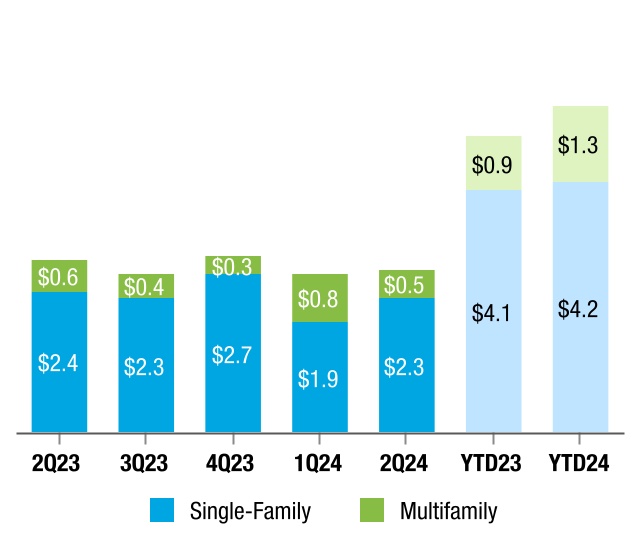
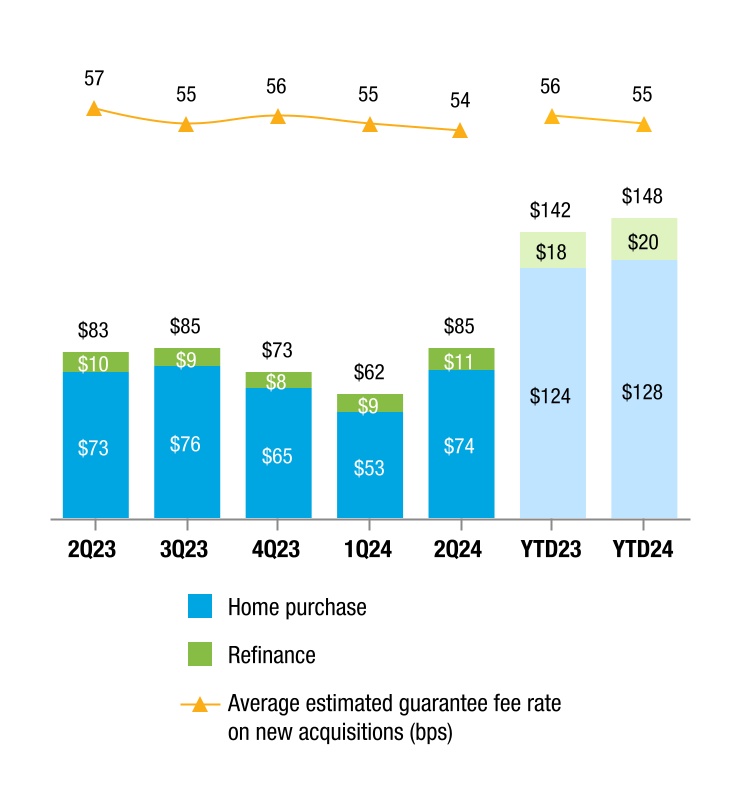
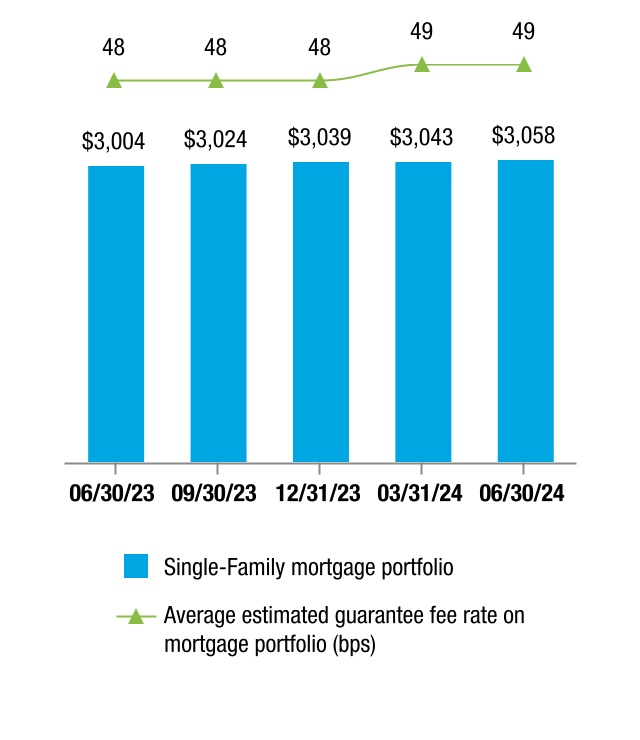
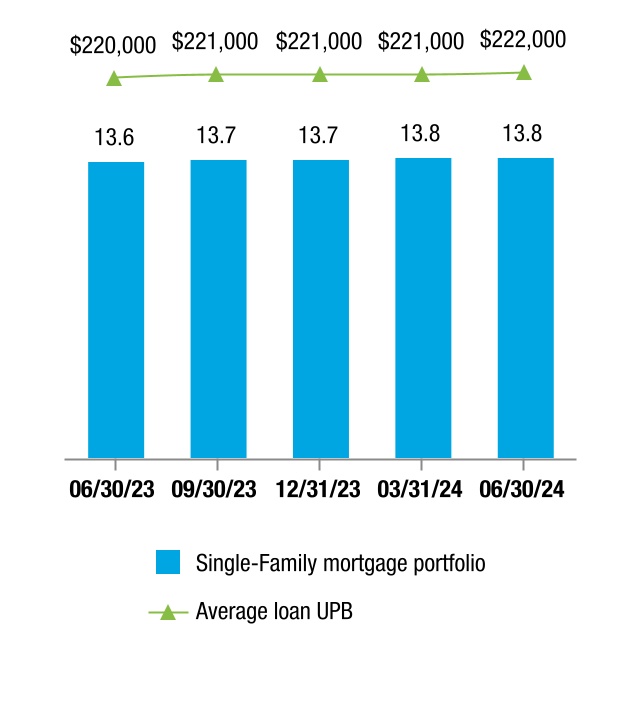
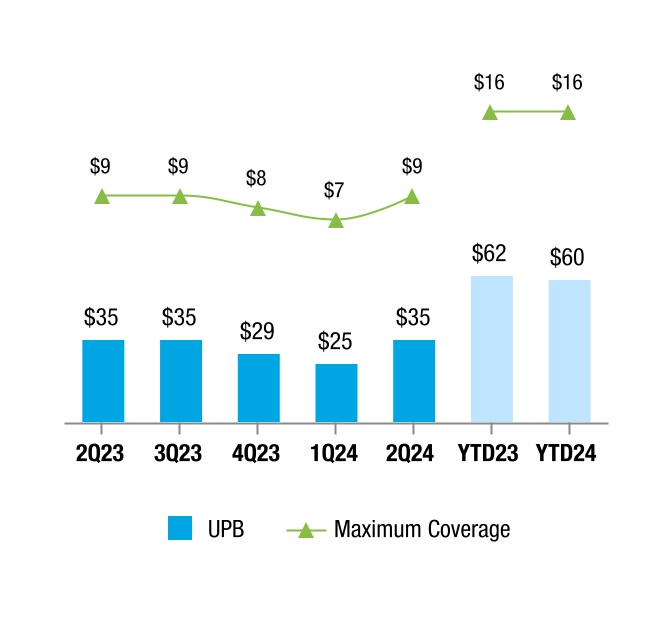
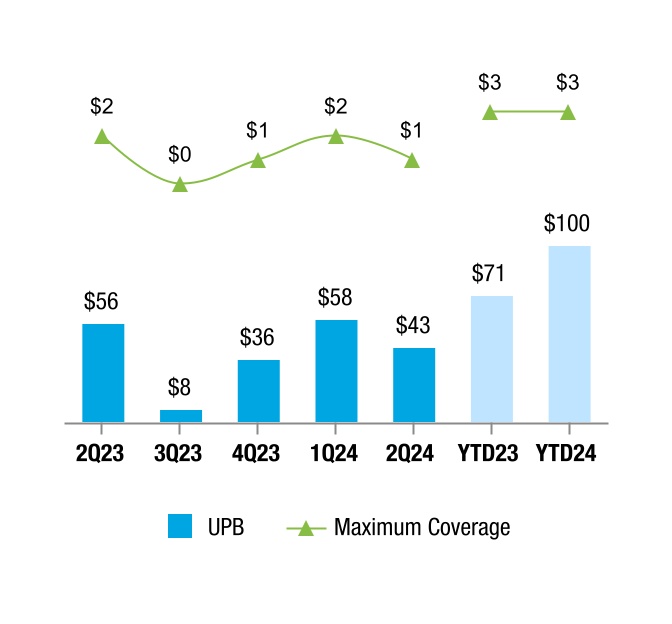
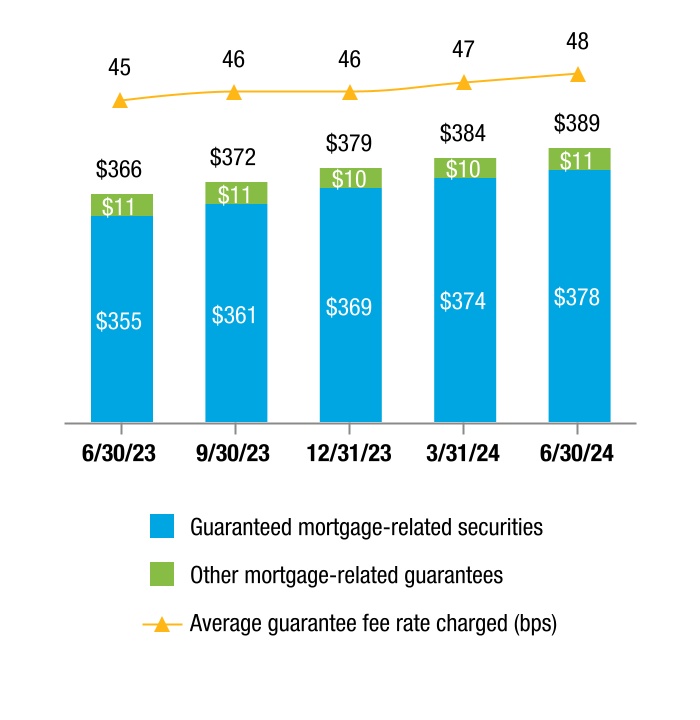
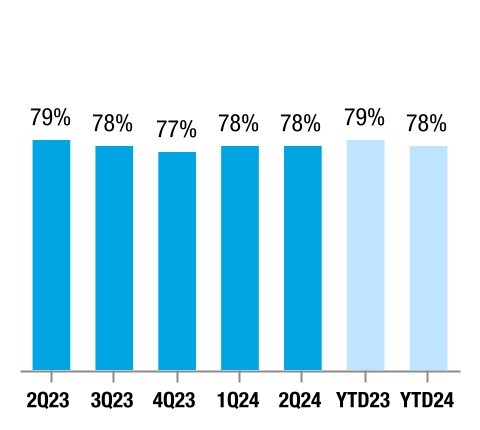
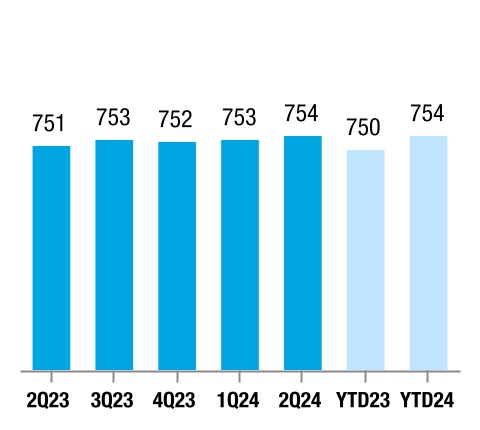
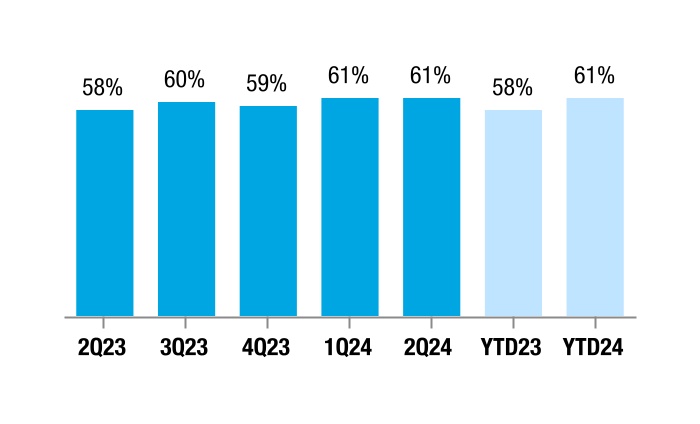
Management's Discussion and Analysis Introduction Mortgage Portfolio Balances Mortgage Portfolio (UPB in billions) Key Drivers: n Our mortgage portfolio increased 2% year-over-year to $3.5 trillion at June 30, 2024, continuing to grow at a moderate pace as new business activity remained low. l Our Single-Family mortgage portfolio was $3.1 trillion at June 30, 2024, up 2% year-over-year. l Our Multifamily mortgage portfolio was $447 billion at June 30, 2024, up 5% year-over-year. Credit Enhancement Coverage Single-Family Mortgage Portfolio with Credit Enhancement (UPB in billions) Multifamily Mortgage Portfolio with Credit Enhancement (UPB in billions) In addition to transferring interest-rate and liquidity risk to third-party investors through our securitization activities, we engage in various types of credit enhancements, such as primary mortgage insurance and CRT transactions, to reduce our credit risk exposure and transfer a portion of the credit risk on certain loans in our mortgage portfolio to third parties. At June 30, 2024, we had credit enhancement coverage on 62% of our Single-Family mortgage portfolio and 95% of our Multifamily mortgage portfolio. See MD&A - Risk Management – Credit Risk for additional information on our credit enhancements. Freddie Mac 2Q 2024 Form 10-Q 3
Management's Discussion and Analysis Housing and Mortgage Market Conditions
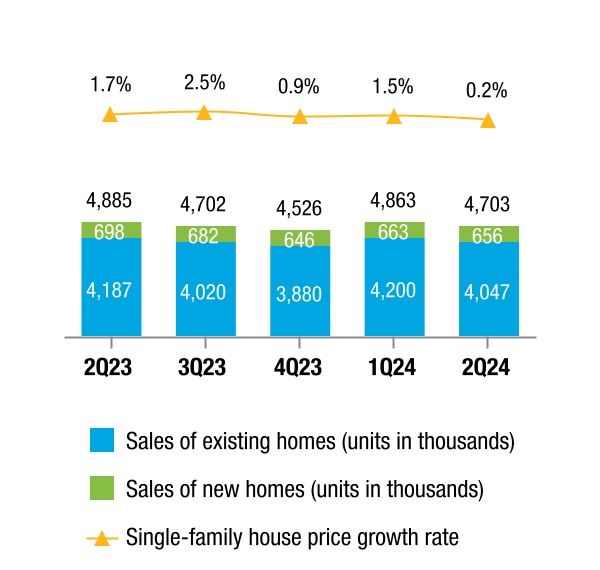
Management's Discussion and Analysis Housing and Mortgage Market Conditions HOUSING AND MORTGAGE MARKET CONDITIONS The following charts present certain housing and mortgage market indicators that can significantly affect our business and financial results. Certain market and macroeconomic prior period data have been updated to reflect revised historical data. For additional information on the effect of these indicators on our business and financial results, see MD&A – Consolidated Results of Operations and MD&A – Our Business Segments . Single-Family U.S. Single-Family Home Sales and House Prices Sources: National Association of Realtors, U.S. Census Bureau, and Freddie Mac House Price Index (seasonally adjusted rate). U.S. Single-Family Mortgage Originations (UPB in billions) Source: Freddie Mac and Inside Mortgage Finance. Single-Family Serious Delinquency Rates Source: Freddie Mac and National Delinquency Survey from the Mortgage Bankers Association. The 2Q 2024 total mortgage market rate is not yet available. Single-Family Mortgage Debt Outstanding (UPB in trillions) Source: Freddie Mac and Federal Reserve Financial Accounts of the United States of America. The 2Q 2024 U.S. single-family mortgage debt outstanding balance is not yet available. Freddie Mac 2Q 2024 Form 10-Q 4
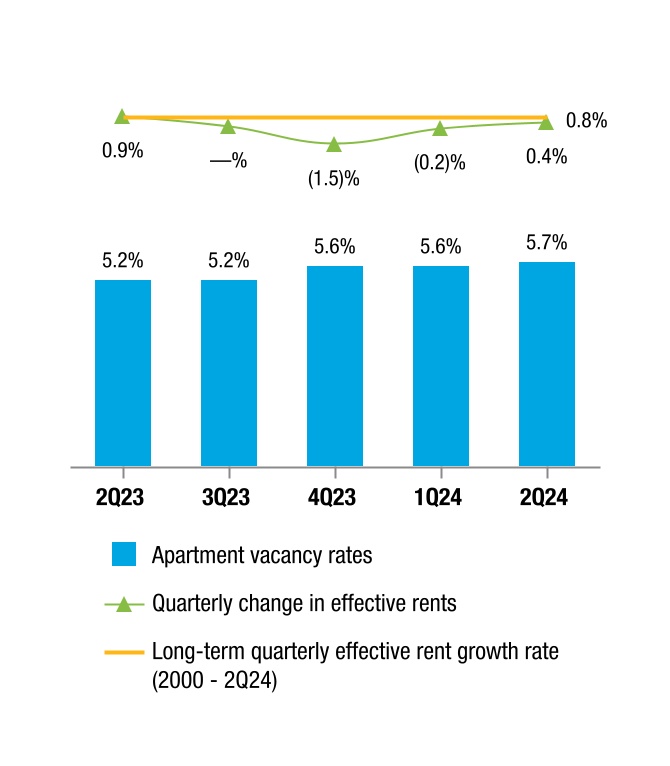
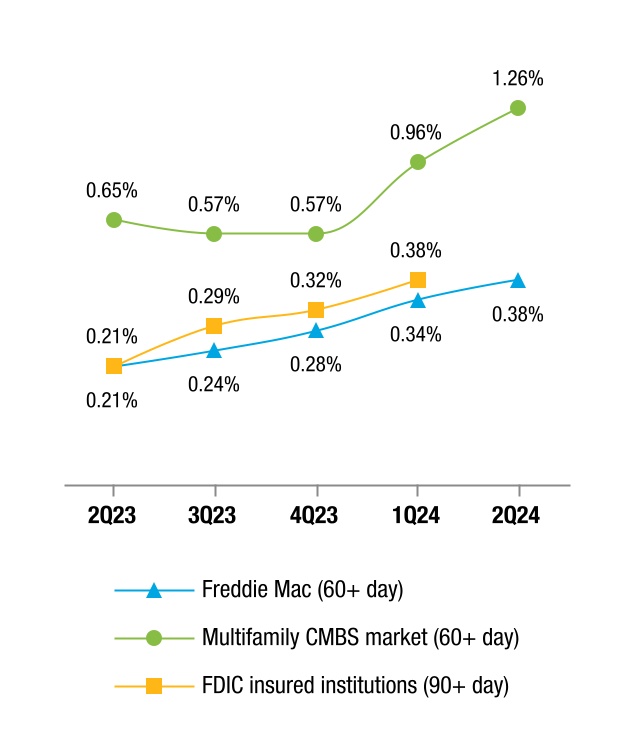
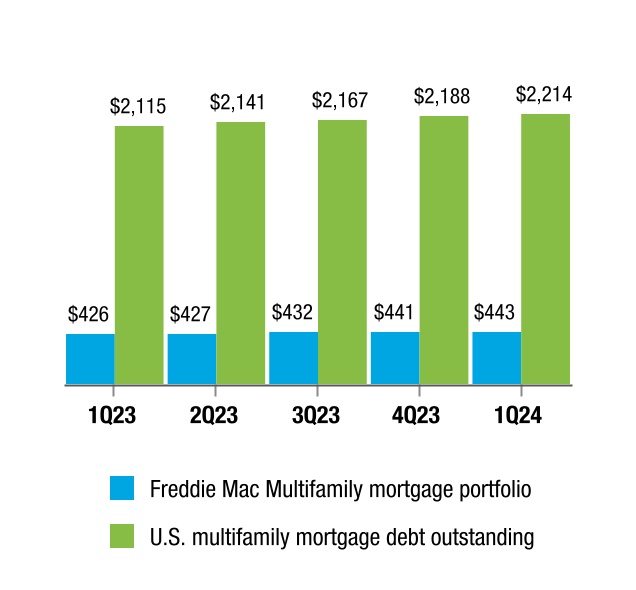
Management's Discussion and Analysis Housing and Mortgage Market Conditions
Management's Discussion and Analysis Housing and Mortgage Market Conditions Multifamily Apartment Vacancy Rates and Change in Effective Rents Source: Reis. Multifamily Property Price Growth Rate Source: Real Capital Analytics Commercial Property Price Index (RCA CPPI). Multifamily Delinquency Rates Source: Freddie Mac, FDIC Quarterly Banking Profile, Intex Solutions, Inc., and Wells Fargo Securities (Multifamily CMBS conduit market, excluding REOs). The 2Q 2024 delinquency rate for FDIC insured institutions is not yet available. Multifamily Mortgage Debt Outstanding (UPB in billions) Source: Freddie Mac and Federal Reserve Financial Accounts of the United States of America. The 2Q 2024 U.S. multifamily mortgage debt outstanding balance is not yet available. Freddie Mac 2Q 2024 Form 10-Q 5
Management's Discussion and Analysis Consolidated Results of Operations
Management's Discussion and Analysis Consolidated Results of Operations CONSOLIDATED RESULTS OF OPERATIONS The discussion of our consolidated results of operations should be read in conjunction with our condensed consolidated financial statements and accompanying notes. The table below compares our summarized consolidated results of operations. Table 1 - Summary of Consolidated Statements of Income and Comprehensive Income Change Change (Dollars in millions) 2Q 2024 2Q 2023 $ % (1) YTD 2024 YTD 2023 $ % (1) Net interest income $4,928 $4,523 $405 9 % $9,687 $9,024 $663 7 % Non-interest income 1,060 816 244 30 2,058 1,142 916 80 Net revenues 5,988 5,339 649 12 11,745 10,166 1,579 16 (Provision) benefit for credit losses (394) 537 (931) NM (575) 142 (717) NM Non-interest expense (2,134) (2,204) 70 3 (4,256) (4,136) (120) (3) Income before income tax expense 3,460 3,672 (212) (6) 6,914 6,172 742 12 Income tax expense (695) (728) 33 5 (1,383) (1,233) (150) (12) Net income 2,765 2,944 (179) (6) 5,531 4,939 592 12 Other comprehensive income (loss), net of taxes and reclassification adjustments (5) (54) 49 91 (30) — (30) NM Comprehensive income $2,760 $2,890 ($130) (4) % $5,501 $4,939 $562 11 % (1) NM - not meaningful. Net Revenues Net Interest Income The table below presents the components of net interest income. Table 2 - Components of Net Interest Income Change Change (Dollars in millions) 2Q 2024 2Q 2023 $ % YTD 2024 YTD 2023 $ % Guarantee net interest income: Contractual net interest income $3,814 $3,658 $156 4 % $7,586 $7,324 $262 4 % Deferred fee income 179 232 (53) (23) 345 439 (94) (21) Total guarantee net interest income 3,993 3,890 103 3 7,931 7,763 168 2 Investments net interest income 1,570 1,611 (41) (3) 3,084 3,043 41 1 Impact on net interest income from hedge accounting (635) (978) 343 35 (1,328) (1,782) 454 25 Net interest income $4,928 $4,523 $405 9 % $9,687 $9,024 $663 7 % Key Drivers: n Guarantee net interest inco
Management's Discussion and Analysis Consolidated Results of Operations
Management's Discussion and Analysis Consolidated Results of Operations Net Interest Yield Analysis The table below presents a yield analysis of interest-earning assets and interest-bearing liabilities. Table 3 - Analysis of Net Interest Yield 2Q 2024 2Q 2023 (Dollars in millions) Average Balance Interest Income (Expense) Average Rate Average Balance Interest Income (Expense) Average Rate Interest-earning assets: Cash and cash equivalents $11,368 $123 4.26 % $13,572 $135 3.93 % Securities purchased under agreements to resell 116,817 1,593 5.46 127,016 1,622 5.11 Investment securities 41,899 484 4.62 39,617 363 3.67 Mortgage loans (1) 3,113,656 26,821 3.45 3,047,556 23,598 3.10 Other assets 2,610 43 6.51 2,749 37 5.40 Total interest-earning assets 3,286,350 29,064 3.54 3,230,510 25,755 3.19 Interest-bearing liabilities: Debt of consolidated trusts 3,049,378 (21,634) (2.84) 2,984,057 (18,608) (2.49) Debt of Freddie Mac 180,158 (2,502) (5.55) 201,432 (2,624) (5.21) Total interest-bearing liabilities 3,229,536 (24,136) (2.99) 3,185,489 (21,232) (2.67) Impact of net non-interest-bearing funding 56,814 — 0.05 45,021 — 0.04 Total funding of interest-earning assets 3,286,350 (24,136) (2.94) 3,230,510 (21,232) (2.63) Net interest income/yield $4,928 0.60 % $4,523 0.56 % (1) Loan fees included in net interest income were $0.3 billion during both 2Q 2024 and 2Q 2023. YTD 2024 YTD 2023 (Dollars in millions) Average Balance Interest Income (Expense) Average Rate Average Balance Interest Income (Expense) Average Rate Interest-earning assets: Cash and cash equivalents $11,754 $248 4.17 % $13,665 $256 3.72 % Securities purchased under agreements to resell 114,307 3,125 5.47 117,266 2,842 4.85 Investment securities 41,596 954 4.59 38,871 679 3.49 Mortgage loans (1) 3,106,884 53,050 3.42 3,044,843 46,902 3.08 Other assets 2,197 72 6.49 2,339 63 5.36 Total interest-earning assets 3,276,738 57,449 3.50 3,216,984 50,742 3.15
Management's Discussion and Analysis Consolidated Results of Operations
Management's Discussion and Analysis Consolidated Results of Operations Non-Interest Income The table below presents the components of non-interest income. Table 4 - Components of Non-Interest Income Change Change (Dollars in millions) 2Q 2024 2Q 2023 $ % YTD 2024 YTD 2023 $ % Guarantee income $383 $309 $74 24 % $879 $775 $104 13 % Investment gains, net 549 411 138 34 954 186 768 413 Other income 128 96 32 33 225 181 44 24 Non-interest income $1,060 $816 $244 30 % $2,058 $1,142 $916 80 % Key Drivers: n Guarantee income l 2Q 2024 vs. 2Q 2023 - Increased primarily due to lower fair value losses on guarantee assets as a result of smaller medium-term interest rate increases in 2Q 2024. l YTD 2024 vs. YTD 2023 - Increased primarily due to favorable fair value changes on guarantee assets from prepayment rates. n Investment gains, net l 2Q 2024 vs. 2Q 2023 - Increased primarily due to impacts from interest-rate risk management activities. l YTD 2024 vs. YTD 2023 - Increased primarily due to higher revenues from held-for-sale loan purchase and securitization activities and impacts from interest-rate risk management activities. (Provision) Benefit for Credit Losses The table below presents the components of provision for credit losses. Table 5 - (Provision) Benefit for Credit Losses Change Change (Dollars in millions) 2Q 2024 2Q 2023 $ % (1) YTD 2024 YTD 2023 $ % (1) Single-Family ($315) $638 ($953) NM ($435) $320 ($755) NM Multifamily (79) (101) 22 22 % (140) (178) 38 21 % (Provision) benefit for credit losses ($394) $537 ($931) NM ($575) $142 ($717) NM (1) NM - not meaningful. Key Drivers: n 2Q 2024 vs. 2Q 2023 - The provision for credit losses for 2Q 2024 was primarily driven by a credit reserve build in Single-Family attributable to new acquisitions. The benefit for credit losses for 2Q 2023 was primarily driven by a credit reserve release in Single-Family due to improvements in house prices, partially offset by a credit reserve build i
Management's Discussion and Analysis Consolidated Results of Operations
Management's Discussion and Analysis Consolidated Results of Operations Non-Interest Expense The table below presents the components of non-interest expense. Table 6 - Components of Non-Interest Expense Change Change (Dollars in millions) 2Q 2024 2Q 2023 $ % YTD 2024 YTD 2023 $ % Salaries and employee benefits ($420) ($405) ($15) (4) % ($841) ($779) ($62) (8) % Credit enhancement expense (588) (590) 2 — (1,185) (1,120) (65) (6) Benefit for (decrease in) credit enhancement recoveries (7) (108) 101 94 (6) (59) 53 90 Legislative assessments expense: Legislated guarantee fees expense (728) (710) (18) (3) (1,452) (1,418) (34) (2) Affordable housing funds allocation (40) (41) 1 2 (70) (68) (2) (3) Total legislative assessments expense (768) (751) (17) (2) (1,522) (1,486) (36) (2) Other expense (351) (350) (1) — (702) (692) (10) (1) Non-interest expense ($2,134) ($2,204) $70 3 % ($4,256) ($4,136) ($120) (3) % Key Drivers: n Credit enhancement expense l YTD 2024 vs. YTD 2023 - Increased primarily due to higher expenses related to STACR Trust note repurchases. n Benefit for (decrease in) credit enhancement recoveries l 2Q 2024 vs. 2Q 2023 and YTD 2024 vs. YTD 2023 - Decreased primarily due to a smaller decrease in expected credit losses on covered loans. n Legislative assessments expense l YTD 2024 vs. YTD 2023 - Increased primarily due to higher legislated guarantee fees expense as a result of growth in our Single-Family mortgage portfolio. Freddie Mac 2Q 2024 Form 10-Q 9
Management's Discussion and Analysis Consolidated Balance Sheets Analysis
Management's Discussion and Analysis Consolidated Balance Sheets Analysis CONSOLIDATED BALANCE SHEETS ANALYSIS The table below compares our summarized condensed consolidated balance sheets. Table 7 - Summarized Condensed Consolidated Balance Sheets Change (Dollars in millions) June 30, 2024 December 31, 2023 $ % Assets: Cash and cash equivalents $5,532 $6,019 ($487) (8) % Securities purchased under agreements to resell 97,180 95,148 2,032 2 Investment securities, at fair value 43,480 43,275 205 — Mortgage loans held-for-sale 12,346 12,941 (595) (5) Mortgage loans held-for-investment 3,105,869 3,083,665 22,204 1 Accrued interest receivable, net 10,445 9,925 520 5 Deferred tax assets, net 4,795 4,076 719 18 Other assets 27,605 25,927 1,678 6 Total assets $3,307,252 $3,280,976 $26,276 1 % Liabilities and Equity: Liabilities: Accrued interest payable $9,346 $8,812 $534 6 % Debt 3,227,612 3,208,346 19,266 1 Other liabilities 17,071 16,096 975 6 Total liabilities 3,254,029 3,233,254 20,775 1 Total equity 53,223 47,722 5,501 12 Total liabilities and equity $3,307,252 $3,280,976 $26,276 1 % Key Drivers: As of June 30, 2024 compared to December 31, 2023: n Mortgage loans held-for-investment increased primarily due to growth in our Single-Family mortgage portfolio. n Debt increased due to an increase in debt of consolidated trusts driven by growth in our Single-Family mortgage portfolio. Freddie Mac 2Q 2024 Form 10-Q 10
Management's Discussion and Analysis Our Portfolios
Management's Discussion and Analysis Our Portfolios OUR PORTFOLIOS Mortgage Portfolio The table below presents the UPB of our mortgage portfolio by segment. Table 8 - Mortgage Portfolio June 30, 2024 December 31, 2023 (In millions) Single-Family Multifamily Total Single-Family Multifamily Total Mortgage loans held-for-investment: By consolidated trusts $2,977,525 $55,395 $3,032,920 $2,963,296 $47,433 $3,010,729 By Freddie Mac 39,012 9,719 48,731 33,213 11,770 44,983 Total mortgage loans held-for-investment 3,016,537 65,114 3,081,651 2,996,509 59,203 3,055,712 Mortgage loans held-for-sale 3,244 9,660 12,904 3,527 9,905 13,432 Total mortgage loans 3,019,781 74,774 3,094,555 3,000,036 69,108 3,069,144 Mortgage-related guarantees: Mortgage loans held by nonconsolidated trusts 30,188 361,442 391,630 30,182 360,928 391,110 Other mortgage-related guarantees 8,325 11,054 19,379 8,692 10,761 19,453 Total mortgage-related guarantees 38,513 372,496 411,009 38,874 371,689 410,563 Total mortgage portfolio $3,058,294 $447,270 $3,505,564 $3,038,910 $440,797 $3,479,707 Guaranteed mortgage-related securities: Issued by consolidated trusts $2,988,924 $55,426 $3,044,350 $2,970,707 $47,436 $3,018,143 Issued by nonconsolidated trusts 24,553 322,434 346,987 24,600 321,262 345,862 Total guaranteed mortgage-related securities $3,013,477 $377,860 $3,391,337 $2,995,307 $368,698 $3,364,005 Investments Portfolio Our investments portfolio consists of our mortgage-related investments portfolio and our other investments portfolio. Mortgage-Related Investments Portfolio The Purchase Agreement limits the size of our mortgage-related investments portfolio to a maximum amount of $225 billion. The calculation of mortgage assets subject to the Purchase Agreement cap includes the UPB of mortgage assets and 10% of the notional value of interest-only securities. We are also subject to additional limitations on the size and composition of our mortgage-related investments p
Management's Discussion and Analysis Our Portfolios
Management's Discussion and Analysis Our Portfolios The table below presents the details of our mortgage-related investments portfolio. Table 9 - Mortgage-Related Investments Portfolio June 30, 2024 December 31, 2023 (In millions) Single-Family Multifamily Total Single-Family Multifamily Total Unsecuritized mortgage loans: Securitization pipeline loans (1) $12,397 $13,696 $26,093 $8,225 $15,197 $23,422 Other loans (2) 29,859 5,683 35,542 28,515 6,478 34,993 Total unsecuritized mortgage loans 42,256 19,379 61,635 36,740 21,675 58,415 Mortgage-related securities: Investment securities 2,890 4,272 7,162 2,667 4,613 7,280 Debt of consolidated trusts 18,234 638 18,872 18,639 660 19,299 Total mortgage-related securities 21,124 4,910 26,034 21,306 5,273 26,579 Mortgage-related investments portfolio $63,380 $24,289 $87,669 $58,046 $26,948 $84,994 10% of notional amount of interest-only securities $22,759 $22,186 Mortgage-related investments portfolio for purposes of Purchase Agreement cap 110,428 107,180 (1) Single-family and multifamily loans that we have purchased for cash and aggregate on our balance sheet for securitization within the normal course of business. (2) Primarily includes delinquent and modified single-family loans that we have purchased from securitization trusts. Other Investments Portfolio The table below presents the details of the carrying value of our other investments portfolio. Table 10 - Other Investments Portfolio June 30, 2024 December 31, 2023 (In millions) Liquidity and Contingency Operating Portfolio Custodial Account Other Total Other Investments Portfolio Liquidity and Contingency Operating Portfolio Custodial Account Other Total Other Investments Portfolio Cash and cash equivalents $4,326 $1,100 $106 $5,532 $5,041 $890 $88 $6,019 Securities purchased under agreements to resell 95,476 12,692 1,088 109,256 94,904 9,396 1,093 105,393 Non-mortgage related securities (1) 25,488 — 5,501 30,989 24,153 — 6,119 30
Management's Discussion and Analysis Our Business Segments
Management's Discussion and Analysis Our Business Segments OUR BUSINESS SEGMENTS As shown in the table below, we have two reportable segments, which are based on the way we manage our business. Segment Description Single-Family Reflects results from our purchase, securitization, and guarantee of single-family loans, our investments in single-family loans and mortgage-related securities, the management of Single-Family mortgage credit risk and market risk, and any results of our treasury function that are not allocated to each segment. Multifamily Reflects results from our purchase, securitization, and guarantee of multifamily loans, our investments in multifamily loans and mortgage-related securities, and the management of Multifamily mortgage credit risk and market risk. Segment Net Revenues and Net Income The charts below show our net revenues and net income by segment. Segment Net Revenues (In billions) Segment Net Income (In billions) Freddie Mac 2Q 2024 Form 10-Q 13
Management's Discussion and Analysis Our Business Segments | Single-Family
Management's Discussion and Analysis Our Business Segments | Single-Family Single-Family Business Results The charts, tables,