Halliburton Co. Files 10-Q for Period Ending March 31, 2024
Ticker: HAL · Form: 10-Q · Filed: Apr 24, 2024 · CIK: 45012
| Field | Detail |
|---|---|
| Company | Halliburton CO (HAL) |
| Form Type | 10-Q |
| Filed Date | Apr 24, 2024 |
| Risk Level | medium |
| Pages | 16 |
| Reading Time | 19 min |
| Key Dollar Amounts | $2.50, $3.5 billion |
| Sentiment | neutral |
Sentiment: neutral
Topics: Halliburton, 10-Q, Q1 2024, Oilfield Services, Financials
TL;DR
<b>Halliburton Co. filed its Q1 2024 10-Q, detailing financial performance and segment operations.</b>
AI Summary
HALLIBURTON CO (HAL) filed a Quarterly Report (10-Q) with the SEC on April 24, 2024. Halliburton Co. reported financial results for the first quarter of 2024, ending March 31, 2024. The filing covers the period from January 1, 2024, to March 31, 2024. Key segments include Completion and Production, and Drilling and Evaluation. Geographic revenue concentration is noted in the US and Mexico. The company's fiscal year ends on December 31.
Why It Matters
For investors and stakeholders tracking HALLIBURTON CO, this filing contains several important signals. This 10-Q provides investors with the latest financial performance data for Halliburton Co. in Q1 2024, crucial for assessing operational health and strategic direction. Understanding the segment performance (Completion and Production, Drilling and Evaluation) and geographic revenue concentrations (US, Mexico) is key to evaluating the company's market position and potential risks.
Risk Assessment
Risk Level: medium — HALLIBURTON CO shows moderate risk based on this filing. The company notes geographic concentration risk in the US and Mexico for both sales revenue and accounts receivable, indicating potential vulnerability to regional economic or political factors.
Analyst Insight
Investors should monitor Halliburton's performance in North America, particularly the US and Mexico, given the stated geographic concentration risks.
Key Numbers
- 2024-03-31 — Reporting Period End Date (Conformed period of report)
- 2024-04-24 — Filing Date (Filed as of date)
- 2024-01-01 — Quarter Start Date (Q1 2024 period)
- 2023-03-31 — Prior Year Q1 End Date (Comparison period)
Key Players & Entities
- HALLIBURTON CO (company) — Filer name
- 2024-03-31 (date) — Conformed period of report
- 2024-04-24 (date) — Filed as of date
- 10-Q (form) — Form type
- Completion and Production (segment) — Operating segment
- Drilling and Evaluation (segment) — Operating segment
- US (country) — Geographic concentration risk
- Mexico (country) — Geographic concentration risk
FAQ
When did HALLIBURTON CO file this 10-Q?
HALLIBURTON CO filed this Quarterly Report (10-Q) with the SEC on April 24, 2024.
What is a 10-Q filing?
A 10-Q is a quarterly financial report with unaudited financials, management discussion, and interim business updates. This particular 10-Q was filed by HALLIBURTON CO (HAL).
Where can I read the original 10-Q filing from HALLIBURTON CO?
You can access the original filing directly on the SEC's EDGAR system. The filing is publicly available and includes all exhibits and attachments submitted by HALLIBURTON CO.
What are the key takeaways from HALLIBURTON CO's 10-Q?
HALLIBURTON CO filed this 10-Q on April 24, 2024. Key takeaways: Halliburton Co. reported financial results for the first quarter of 2024, ending March 31, 2024.. The filing covers the period from January 1, 2024, to March 31, 2024.. Key segments include Completion and Production, and Drilling and Evaluation..
Is HALLIBURTON CO a risky investment based on this filing?
Based on this 10-Q, HALLIBURTON CO presents a moderate-risk profile. The company notes geographic concentration risk in the US and Mexico for both sales revenue and accounts receivable, indicating potential vulnerability to regional economic or political factors.
What should investors do after reading HALLIBURTON CO's 10-Q?
Investors should monitor Halliburton's performance in North America, particularly the US and Mexico, given the stated geographic concentration risks. The overall sentiment from this filing is neutral.
How does HALLIBURTON CO compare to its industry peers?
Halliburton operates in the oil and gas field services industry, providing a range of products and services to exploration and production companies worldwide.
Are there regulatory concerns for HALLIBURTON CO?
As a publicly traded company, Halliburton is subject to SEC regulations and reporting requirements, including the filing of quarterly 10-Q reports.
Risk Factors
- Geographic Concentration Risk [medium — market]: The company's operations and financial results are concentrated in specific geographic areas, primarily the US and Mexico, making it susceptible to regional economic, political, or regulatory changes.
Industry Context
Halliburton operates in the oil and gas field services industry, providing a range of products and services to exploration and production companies worldwide.
Regulatory Implications
As a publicly traded company, Halliburton is subject to SEC regulations and reporting requirements, including the filing of quarterly 10-Q reports.
What Investors Should Do
- Analyze Q1 2024 revenue and profitability by segment (Completion and Production, Drilling and Evaluation).
- Assess the impact of geographic concentration risks in the US and Mexico on the company's financial performance.
- Compare Q1 2024 results against the prior year's Q1 to identify year-over-year trends.
Key Dates
- 2024-03-31: Quarter End — End of the reporting period for the 10-Q filing.
- 2024-04-24: Filing Date — Date the 10-Q was officially filed with the SEC.
Year-Over-Year Comparison
This filing represents the first quarterly report (10-Q) for the fiscal year 2024, providing updated financial information compared to the previous year's filings.
Filing Stats: 4,778 words · 19 min read · ~16 pages · Grade level 15.4 · Accepted 2024-04-24 11:32:30
Key Financial Figures
- $2.50 — ich registered Common Stock, par value $2.50 per share HAL New York Stock Exchange
- $3.5 billion — 16 relates to the classification of the $3.5 billion ordinary deduction that we claimed for
Filing Documents
- hal-20240331.htm (10-Q) — 668KB
- hal_03312024-ex311.htm (EX-31.1) — 8KB
- hal_03312024-ex312.htm (EX-31.2) — 8KB
- hal_03312024-ex321.htm (EX-32.1) — 4KB
- hal_03312024-ex322.htm (EX-32.2) — 4KB
- hal_03312024-ex95.htm (EX-95) — 51KB
- hal-20240331_g1.jpg (GRAPHIC) — 25KB
- hal-20240331_g2.jpg (GRAPHIC) — 30KB
- hal-20240331_g3.jpg (GRAPHIC) — 52KB
- 0000045012-24-000015.txt ( ) — 4487KB
- hal-20240331.xsd (EX-101.SCH) — 31KB
- hal-20240331_cal.xml (EX-101.CAL) — 48KB
- hal-20240331_def.xml (EX-101.DEF) — 196KB
- hal-20240331_lab.xml (EX-101.LAB) — 392KB
- hal-20240331_pre.xml (EX-101.PRE) — 295KB
- hal-20240331_htm.xml (XML) — 497KB
Financial Statements
Financial Statements 1 Condensed Consolidated Statements of Operations 1 Condensed Consolidated Statements of Comprehensive Income 2 Condensed Consolidated Balance Sheets 3 Condensed Consolidated Statements of Cash Flows 4 Notes to Condensed Consolidated Financial Statements 5 Note 1. Basis of Presentation 5 Note 2. Business Segment Information 5 Note 3. Revenue 6 Note 4. Inventories 8 Note 5. Accounts Payable 8 Note 6. Income Taxes 8 Note 7. Shareholders' Equity 9 Note 8. Commitments and Contingencies 10 Note 9. Income per Share 10 Note 10. Fair Value of Financial Instruments 11 Item 2.
Management's Discussion and Analysis of Financial Condition and Results of Operations
Management's Discussion and Analysis of Financial Condition and Results of Operations 12 Executive Overview 12 Liquidity and Capital Resources 15 Business Environment and Results of Operations 17 Results of Operations in 2024 Compared to 2023 19 Forward-Looking Information 22 Item 3.
Quantitative and Qualitative Disclosures About Market Risk
Quantitative and Qualitative Disclosures About Market Risk 22 Item 4.
Controls and Procedures
Controls and Procedures 22 PART II. OTHER INFORMATION 23 Item 1.
Legal Proceedings
Legal Proceedings 23
Risk Factors
Risk Factors 23 Item 2. Unregistered Sales of Equity Securities and Use of Proceeds 24 Item 3. Defaults Upon Senior Securities 24 Item 4. Mine Safety Disclosures 24 Item 5. Other Information 25 Item 6. Exhibits 26
SIGNATURES
SIGNATURES 27 Table of Contents
FINANCIAL INFORMATION
PART I. FINANCIAL INFORMATION
Financial Statements
Item 1. Financial Statements HALLIBURTON COMPANY Condensed Consolidated Statements of Operations (Unaudited) Three Months Ended March 31 Millions of dollars and shares except per share data 2024 2023 Revenue: Services $ 4,146 $ 4,166 Product sales 1,658 1,511 Total revenue 5,804 5,677 Operating costs and expenses: Cost of services 3,428 3,399 Cost of sales 1,294 1,247 General and administrative 61 54 SAP S4 upgrade expense 34 — Total operating costs and expenses 4,817 4,700 Operating income 987 977 Interest expense, net of interest income of $ 22 and $ 17 ( 92 ) ( 101 ) Other, net ( 108 ) ( 47 ) Income before income taxes 787 829 Income tax provision ( 178 ) ( 174 ) Net income $ 609 $ 655 Net income attributable to noncontrolling interest ( 3 ) ( 4 ) Net income attributable to company $ 606 $ 651 Basic and diluted net income per share $ 0.68 $ 0.72 Basic weighted average common shares outstanding 889 904 Diluted weighted average common shares outstanding 891 907 See notes to condensed consolidated financial statements. HAL Q1 2024 FORM 10-Q | 1 Table of Contents HALLIBURTON COMPANY Condensed Consolidated Statements of Comprehensive Income (Unaudited) Three Months Ended March 31 Millions of dollars 2024 2023 Net income $ 609 $ 655 Other comprehensive income, net of income taxes — 1 Comprehensive income $ 609 $ 656 Comprehensive income attributable to noncontrolling interest ( 4 ) ( 4 ) Comprehensive income attributable to company shareholders $ 605 $ 652 See notes to condensed consolidated financial statements. HAL Q1 2024 FORM 10-Q | 2 Table of Contents HALLIBURTON COMPANY Condensed Consolidated Balance Sheets (Unaudited) Millions of dollars and shares except per share data March 31, 2024 December 31, 2023 Assets Current assets: Cash and equivalents $ 1,891 $ 2,264 Receivables (net of allowances for credit losses of $ 743 and $ 742 ) 5,103 4,860 Inventories 3,258 3,226 Other current assets 1,171
Item 1 | Notes to Condensed Consolidated Financial Statements
Part I. Item 1 | Notes to Condensed Consolidated Financial Statements HALLIBURTON COMPANY Notes to Condensed Consolidated Financial Statements (Unaudited) Note 1. Basis of Presentation The accompanying unaudited condensed consolidated financial statements were prepared using United States generally accepted accounting principles (GAAP) for interim financial information and the instructions to Form 10-Q and Regulation S-X. Accordingly, these financial statements do not include all information or notes required by U.S. GAAP for annual financial statements and should be read together with our 2023 Annual Report on Form 10-K. Our accounting policies are in accordance with U.S. GAAP. The preparation of financial statements in conformity with these accounting principles requires us to make estimates and assumptions that affect: the reported amounts of assets and liabilities and disclosure of contingent assets and liabilities at the date of the financial statements; and the reported amounts of revenue and expenses during the reporting period. Ultimate results could differ from our estimates. In our opinion, the condensed consolidated financial statements included herein contain all adjustments necessary to present fairly our financial position as of March 31, 2024 and the results of our operations for the three months ended March 31, 2024 and 2023, and our cash flows for the three months ended March 31, 2024 and 2023. Such adjustments are of a normal recurring nature. In addition, certain reclassifications of prior period balances have been made to conform to the current period presentation. The results of our operations for the three months ended March 31, 2024 may not be indicative of results for the full year. Note 2. Business Segment Information We operate under two divisions, which form the basis for the two operating segments we report: the Completion and Production segment and the Drilling and Evaluation segment. Our equity in earnings and loss
Item 1 | Notes to Condensed Consolidated Financial Statements
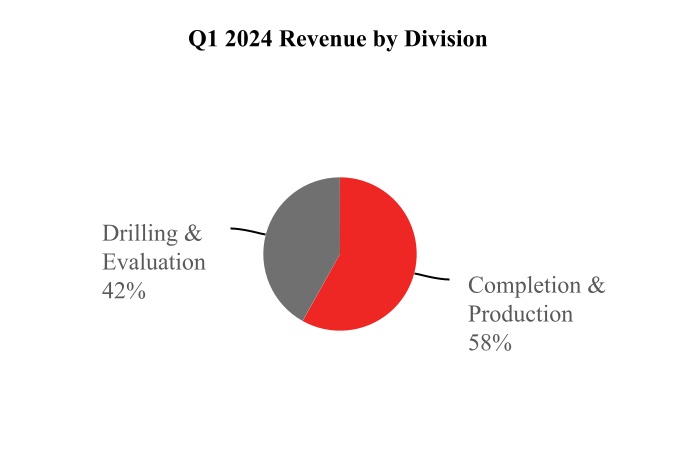
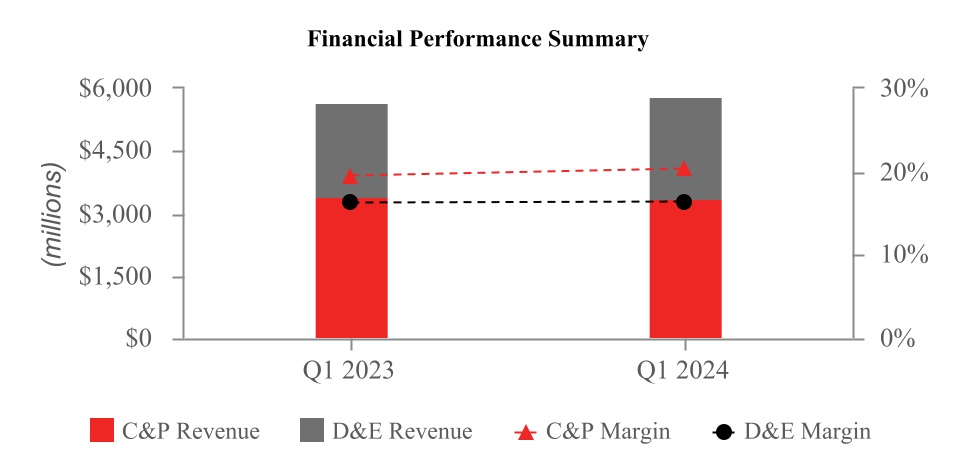
Part I. Item 1 | Notes to Condensed Consolidated Financial Statements The following table presents information on our business segments. Three Months Ended March 31 Millions of dollars 2024 2023 Revenue: Completion and Production $ 3,373 $ 3,409 Drilling and Evaluation 2,431 2,268 Total revenue $ 5,804 $ 5,677 Operating income: Completion and Production $ 688 $ 666 Drilling and Evaluation 398 369 Total operations 1,086 1,035 Corporate and other (a) ( 65 ) ( 58 ) SAP S4 upgrade expense ( 34 ) — Total operating income $ 987 $ 977 Interest expense, net of interest income ( 92 ) ( 101 ) Other, net (b) ( 108 ) ( 47 ) Income before income taxes $ 787 $ 829 (a) Includes certain expenses not attributable to a business segment, such as costs related to support functions, corporate executives, and operating lease assets, and also includes amortization expense associated with intangible assets recorded as a result of acquisitions. (b) During the three months ended March 31, 2024, Halliburton incurred a charge of $ 82 million primarily due to impairment of an investment in Argentina and currency devaluation in Egypt. Note 3. Revenue Revenue is recognized based on the transfer of control or our customers' ability to benefit from our services and products in an amount that reflects the consideration we expect to receive in exchange for those services and products. Most of our service and product contracts are short-term in nature. In recognizing revenue for our services and products, we determine the transaction price of purchase orders or contracts with our customers, which may consist of fixed and variable consideration. We also assess our customers' ability and intention to pay, which is based on a variety of factors, including our historical payment experience with, and the financial condition of, our customers. Payment terms and conditions vary by contract type, although terms generally include a requirement of payment within 20 to 60 days. Other
Item 1 | Notes to Condensed Consolidated Financial Statements
Part I. Item 1 | Notes to Condensed Consolidated Financial Statements The following table presents information on our disaggregated revenue. Three Months Ended March 31 Millions of dollars 2024 2023 Revenue by segment: Completion and Production $ 3,373 $ 3,409 Drilling and Evaluation 2,431 2,268 Total revenue $ 5,804 $ 5,677 Revenue by geographic region: North America $ 2,546 $ 2,765 Latin America 1,108 915 Europe/Africa/CIS 729 662 Middle East/Asia 1,421 1,335 Total revenue $ 5,804 $ 5,677 Contract balances We perform our obligations under contracts with our customers by transferring services and products in exchange for consideration. The timing of our performance often differs from the timing of our customer's payment, which results in the recognition of receivables and deferred revenue. Deferred revenue represents advance consideration received from customers for contracts where revenue is recognized on future performance of service. Deferred revenue, as well as revenue recognized during the period relating to amounts included as deferred revenue at the beginning of the period, was not material to our condensed consolidated financial statements. Transaction price allocated to remaining performance obligations Remaining performance obligations represent firm contracts for which work has not been performed and future revenue recognition is expected. We have elected the practical expedient permitting the exclusion of disclosing remaining performance obligations for contracts that have an original expected duration of one year or less. We have some long-term contracts related to software and integrated project management services such as lump sum turnkey contracts. For software contracts, revenue is generally recognized over the duration of the contract period when the software is considered to be a right to access our intellectual property. For lump sum turnkey projects, we recognize revenue over time using an input method, which requires us to
Item 1 | Notes to Condensed Consolidated Financial Statements
Part I. Item 1 | Notes to Condensed Consolidated Financial Statements Note 4. Inventories Inventories consisted of the following: Millions of dollars March 31, 2024 December 31, 2023 Finished products and parts $ 2,098 $ 2,069 Raw materials and supplies 1,019 1,021 Work in process 141 136 Total inventories $ 3,258 $ 3,226 Note 5. Accounts Payable Effective January 1, 2023, we adopted new supplier finance program disclosure requirements contained in guidance issued by the Financial Accounting Standards Board (ASU 2022-04, "Disclosure of Supplier Finance Program Obligations"). The standards update also includes a prospective annual requirement to disclose a rollforward of the amount of the obligations during the annual reporting period. We will include the rollforward disclosure in our Annual Report on Form 10-K for the year ending December 31, 2024, as required. We have agreements with third parties that allow our participating suppliers to finance payment obligations from us with designated third-party financial institutions who act as our paying agent. We have generally extended our payment terms with suppliers to 90 days. A participating supplier may request a participating financial institution to finance one or more of our payment obligations to such supplier prior to the scheduled due date thereof at a discounted price. We are not required to provide collateral to the financial institutions. Our obligations to participating suppliers, including amounts due and scheduled payment dates, are not impacted by the suppliers' decisions to finance amounts due under these financing arrangements. Our outstanding payment obligations under these agreements were $ 325 million as of March 31, 2024, and $ 322 million as of December 31, 2023, and are included in accounts payable on the condensed consolidated balance sheets. Note 6. Income Taxes During the three months ended March 31, 2024, we recorded a total income tax provision of $ 178 million on a pre
Item 1 | Notes to Condensed Consolidated Financial Statements
Part I. Item 1 | Notes to Condensed Consolidated Financial Statements Note 7. Shareholders' Equity The following tables summarize our shareholders' equity activity for the three months ended March 31, 2024 and March 31, 2023, respectively: Millions of dollars Common Stock Paid-in Capital in Excess of Par Value Treasury Stock Retained Earnings Accumulated Other Comprehensive Income (Loss) Noncontrolling Interest in Consolidated Subsidiaries Total Balance at December 31, 2023 $ 2,663 $ 63 $ ( 5,540 ) $ 12,536 $ ( 331 ) $ 42 $ 9,433 Comprehensive income (loss): Net income — — — 606 — 3 609 Other comprehensive income (loss) — — — — ( 1 ) 1 — Cash dividends ($ 0.17 per share) — — — ( 151 ) — — ( 151 ) Stock repurchase program — — ( 250 ) — — — ( 250 ) Stock plans (a) ( 1 ) ( 63 ) 108 ( 3 ) — — 41 Other — — — — — — — Balance at March 31, 2024 $ 2,662 $ — $ ( 5,682 ) $ 12,988 $ ( 332 ) $ 46 $ 9,682 (a) In the first quarter of 2024, we issued common stock from treasury shares for stock options exercised, restricted stock grants, performance shares under our performance unit program, and purchases under our employee stock purchase plan. As a result, additional paid in capital was reduced to zero, which resulted in a reduction of retained earnings by $ 3 million. Future issuances from treasury shares could similarly impact additional paid in capital and retained earnings. Millions of dollars Common Stock Paid-in Capital in Excess of Par Value Treasury Stock Retained Earnings Accumulated Other Comprehensive Income (Loss) Noncontrolling Interest in Consolidated Subsidiaries Total Balance at December 31, 2022 $ 2,664 $ 50 $ ( 5,108 ) $ 10,572 $ ( 230 ) $ 29 $ 7,977 Comprehensive income (loss): Net income — — — 651 — 4 655 Other comprehensive income — — — — 1 — 1 Cash dividends ($ 0.16 per share) — — — ( 145 ) — — ( 145 ) Stock repurchase program — — ( 100 ) — — — ( 100 ) Stock plans (a) — ( 50 ) 113 ( 3 ) — — 60 Other — — — — — ( 3 ) ( 3 ) Balance a
Item 1 | Notes to Condensed Consolidated Financial Statements
Part I. Item 1 | Notes to Condensed Consolidated Financial Statements Accumulated other comprehensive loss consisted of the following: Millions of dollars March 31, 2024 December 31, 2023 Cumulative translation adjustments $ ( 83 ) $ ( 84 ) Defined benefit and other postretirement liability adjustments ( 210 ) ( 207 ) Other ( 39 ) ( 40 ) Total accumulated other comprehensive loss $ ( 332 ) $ ( 331 ) Note 8. Commitments and Contingencies The Company is subject to various legal or governmental proceedings, claims or investigations, including personal injury, property damage, environmental, intellectual property, commercial, tax, and other matters arising in the ordinary course of business, the resolution of which, in the opinion of management, will not have a material adverse effect on our consolidated results of operations or consolidated financial position. There is inherent risk in any legal or governmental proceeding, claim or investigation, and no assurance can be given as to the outcome of these proceedings. Guarantee arrangements In the normal course of business, we have agreements with financial institutions under which approximately $ 2.6 billion of letters of credit, bank guarantees, or surety bonds were outstanding as of March 31, 2024. Some of the outstanding letters of credit have triggering events that would entitle a bank to require cash collateralization; however, none of these triggering events have occurred. As of March 31, 2024, we had no material off-balance sheet liabilities and were not required to make any material cash distributions to our unconsolidated subsidiaries. Note 9. Income per Share Basic income or loss per share is based on the weighted average number of common shares outstanding during the period. Diluted income per share includes additional common shares that would have been outstanding if potential common shares with a dilutive effect had been issued. Antidilutive securities represent potentially dilutive secur
Item 1 | Notes to Condensed Consolidated Financial Statements
Part I. Item 1 | Notes to Condensed Consolidated Financial Statements Note 10. Fair Value of Financial Instruments The carrying amount of cash and equivalents, receivables, and accounts payable, as reflected in the condensed consolidated balance sheets, approximates fair value due to the short maturities of these instruments. The carrying amount and fair value of our total debt is as follows: March 31, 2024 December 31, 2023 Millions of dollars Level 1 Level 2 Total fair value Carrying value Level 1 Level 2 Total fair value Carrying value Total debt $ 7,294 $ 361 $ 7,655 $ 7,637 $ 7,419 $ 378 $ 7,797 $ 7,636 In the first three months of 2024, the fair value of our total debt decreased as a result of higher bond yields. Our debt categorized within level 1 on the fair value hierarchy is calculated using quoted prices in active markets for identical liabilities with transactions occurring on the last two days of period-end. Our debt categorized within level 2 on the fair value hierarchy is calculated using significant observable inputs for similar liabilities where estimated values are determined from observable data points on our other bonds and on other similarly rated corporate debt or from observable data points of transactions occurring prior to two days from period-end and adjusting for changes in market conditions. Differences between the periods presented in our level 1 and level 2 classification of our long-term debt relate to the timing of when third party market transactions on our debt are executed. We have no debt categorized within level 3 on the fair value hierarchy. HAL Q1 2024 FORM 10-Q | 11 Table of Contents
Item 2 | Executive Overview
Part I. Item 2 | Executive Overview
Management's Discussion and Analysis of Financial Condition and Results of Operations
Item 2. Management's Discussion and Analysis of Financial Condition and Results of Operations Management's Discussion and Analysis of Financial Condition and Results of Operations (MD&A) should be read in conjunction with the condensed consolidated financial statements included in "Item 1. Financial Statements" contained herein. EXECUTIVE OVERVIEW Organization We are one of the world's largest providers of products and services to the energy industry. We help our customers maximize asset value throughout the lifecycle of the reservoir from locating hydrocarbons and managing geological data, to drilling and formation evaluation, well construction and completion, and optimizing production throughout the life of the asset. Activity levels within our operations are significantly impacted by spending on upstream explor