Intel Corp. Files 10-Q for Period Ending March 30, 2024
Ticker: INTC · Form: 10-Q · Filed: Apr 26, 2024 · CIK: 50863
| Field | Detail |
|---|---|
| Company | Intel CORP (INTC) |
| Form Type | 10-Q |
| Filed Date | Apr 26, 2024 |
| Risk Level | medium |
| Pages | 15 |
| Reading Time | 18 min |
| Key Dollar Amounts | $0.001, $12.7 billion, $1.0 billion, $12.7B, $0.18 |
| Sentiment | neutral |
Sentiment: neutral
Topics: Intel, 10-Q, Semiconductors, Financials, Q1 2024
TL;DR
<b>Intel Corp. reported a slight increase in revenue and net income for the quarter ending March 30, 2024.</b>
AI Summary
INTEL CORP (INTC) filed a Quarterly Report (10-Q) with the SEC on April 26, 2024. Intel Corp. reported revenue of $99,315 million for the period ending March 30, 2024, compared to $98,010 million in the prior year. Net income for the period was $4,257 million, a slight increase from $4,228 million in the prior year. Earnings per share (EPS) stood at $0.49 for the period ending March 30, 2024, compared to $0.49 in the prior year. The company's fiscal year ends on December 31st. The filing is a 10-Q, indicating a quarterly report.
Why It Matters
For investors and stakeholders tracking INTEL CORP, this filing contains several important signals. This filing provides an update on Intel's financial performance and operational status for the first quarter of 2024, crucial for investors assessing the company's trajectory. The data reflects Intel's performance in a competitive semiconductor market, offering insights into its ability to maintain market share and profitability.
Risk Assessment
Risk Level: medium — INTEL CORP shows moderate risk based on this filing. The company's performance is subject to the highly cyclical and competitive nature of the semiconductor industry, which can lead to significant fluctuations in revenue and profitability.
Analyst Insight
Investors should monitor Intel's upcoming earnings calls and future filings for updates on product development, market demand, and competitive pressures.
Financial Highlights
- revenue
- 99315
- net Income
- 4257
- eps
- 0.49
- revenue Growth
- 1.33
Key Numbers
- 99,315 — Revenue (For the period ending March 30, 2024)
- 98,010 — Revenue (For the period ending March 30, 2023)
- 4,257 — Net Income (For the period ending March 30, 2024)
- 4,228 — Net Income (For the period ending March 30, 2023)
- 0.49 — EPS (For the period ending March 30, 2024)
- 0.49 — EPS (For the period ending March 30, 2023)
Key Players & Entities
- INTEL CORP (company) — Filer
- INTC (company) — Ticker Symbol
- 2024-03-30 (date) — Period of Report
- 2024-04-26 (date) — Filing Date
- 99,315 (dollar_amount) — Revenue for the period ending March 30, 2024
- 4,257 (dollar_amount) — Net income for the period ending March 30, 2024
- 0.49 (dollar_amount) — Earnings per share for the period ending March 30, 2024
FAQ
When did INTEL CORP file this 10-Q?
INTEL CORP filed this Quarterly Report (10-Q) with the SEC on April 26, 2024.
What is a 10-Q filing?
A 10-Q is a quarterly financial report with unaudited financials, management discussion, and interim business updates. This particular 10-Q was filed by INTEL CORP (INTC).
Where can I read the original 10-Q filing from INTEL CORP?
You can access the original filing directly on the SEC's EDGAR system. The filing is publicly available and includes all exhibits and attachments submitted by INTEL CORP.
What are the key takeaways from INTEL CORP's 10-Q?
INTEL CORP filed this 10-Q on April 26, 2024. Key takeaways: Intel Corp. reported revenue of $99,315 million for the period ending March 30, 2024, compared to $98,010 million in the prior year.. Net income for the period was $4,257 million, a slight increase from $4,228 million in the prior year.. Earnings per share (EPS) stood at $0.49 for the period ending March 30, 2024, compared to $0.49 in the prior year..
Is INTEL CORP a risky investment based on this filing?
Based on this 10-Q, INTEL CORP presents a moderate-risk profile. The company's performance is subject to the highly cyclical and competitive nature of the semiconductor industry, which can lead to significant fluctuations in revenue and profitability.
What should investors do after reading INTEL CORP's 10-Q?
Investors should monitor Intel's upcoming earnings calls and future filings for updates on product development, market demand, and competitive pressures. The overall sentiment from this filing is neutral.
Key Dates
- 2024-03-30: Quarter End — End of the reporting period for the 10-Q filing.
- 2024-04-26: Filing Date — Date the 10-Q report was filed with the SEC.
Filing Stats: 4,452 words · 18 min read · ~15 pages · Grade level 20 · Accepted 2024-04-25 18:20:43
Key Financial Figures
- $0.001 — ange on which registered Common stock, $0.001 par value INTC Nasdaq Global Select Mar
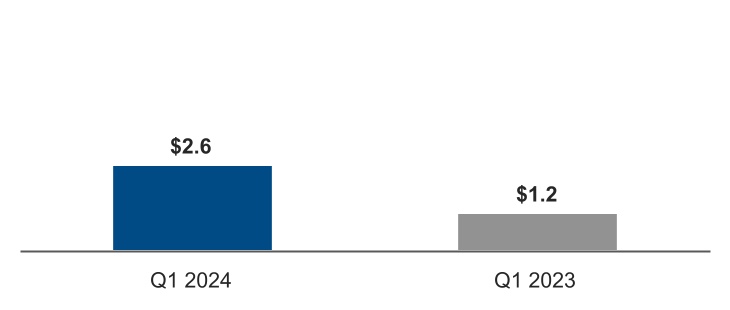
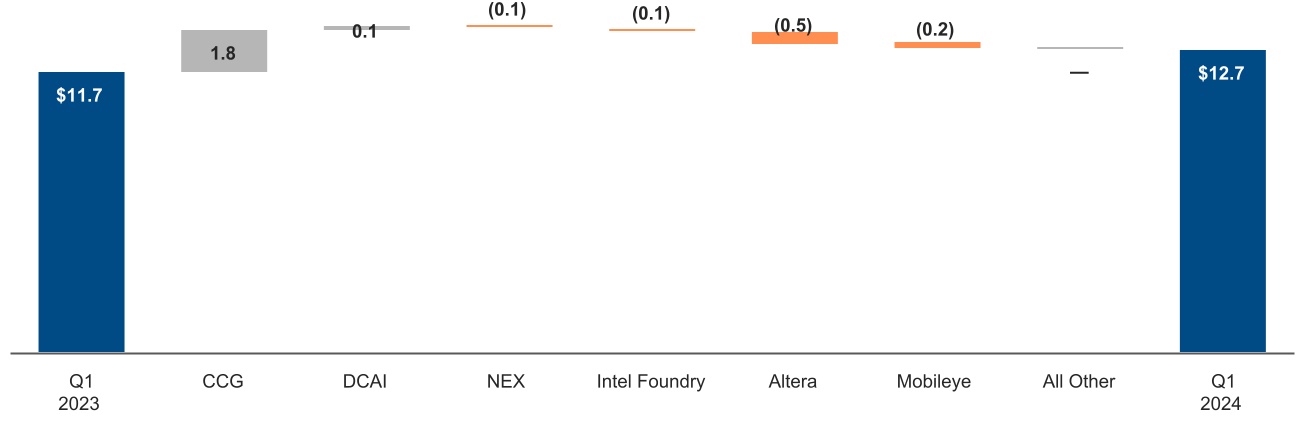
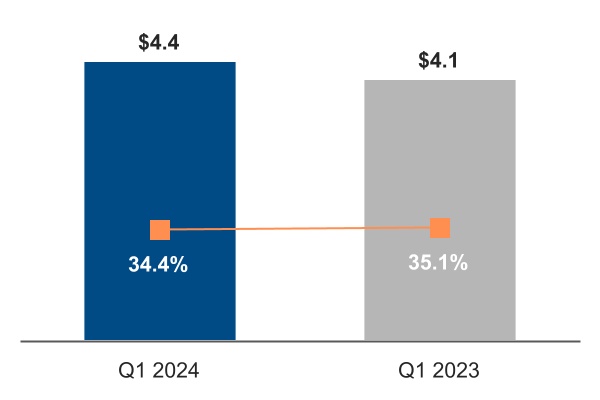
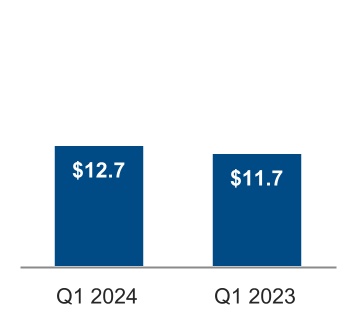
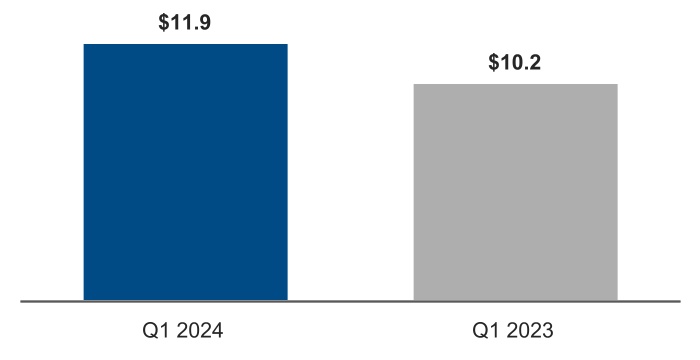
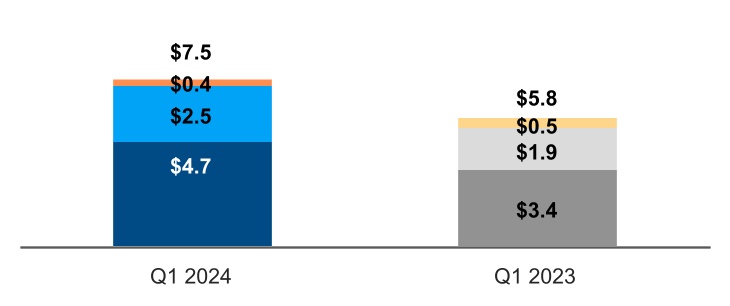
- $12.7 billion — A Quarter in Review Total revenue of $12.7 billion was up $1.0 billion or 9% from Q1 2023,
- $1.0 billion — Total revenue of $12.7 billion was up $1.0 billion or 9% from Q1 2023, as CCG revenue incr
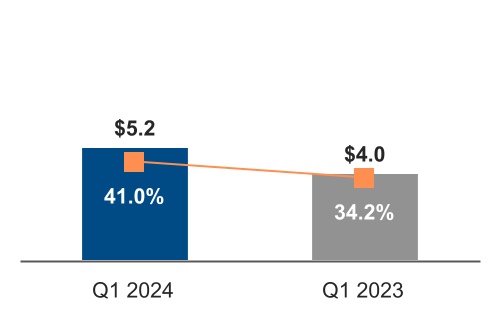
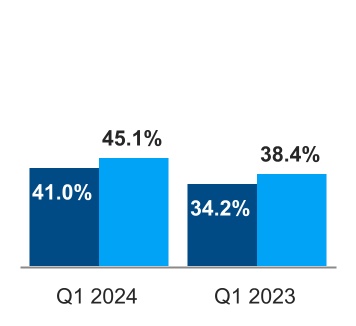
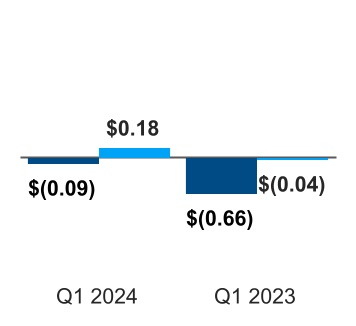
- $12.7B — h Flow $B Adjusted Free Cash Flow $B $12.7B 41.0% 45.1% $(0.09) $0.18 $(1.2)B $(6.2
- $0.18 — sh Flow $B $12.7B 41.0% 45.1% $(0.09) $0.18 $(1.2)B $(6.2)B GAAP GAAP non-GAAP 1
- $1.0B — on-GAAP 1 GAAP non-GAAP 1 Revenue up $1.0B or 9% from Q1 2023 Gross margin up 6.8
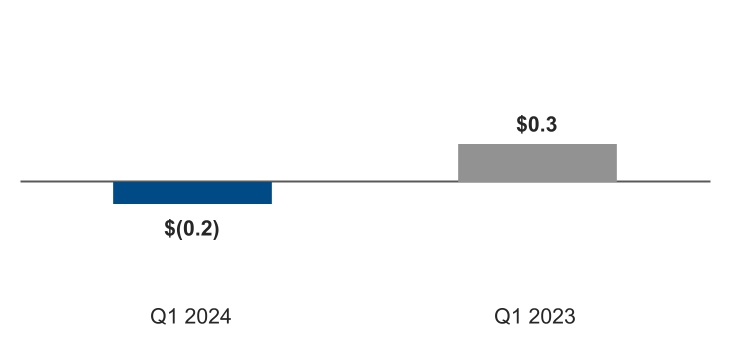
- $0.57 — 23 Diluted EPS attributable to Intel up $0.57 or 86% from Q1 2023 Diluted EPS attribu
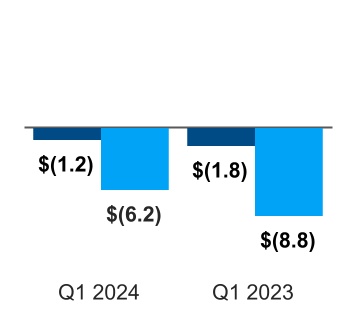
- $0.22 — 23 Diluted EPS attributable to Intel up $0.22 from Q1 2023 Operating cash flow up $0.
- $0.6B — .22 from Q1 2023 Operating cash flow up $0.6B or 31% from Q1 2023 Adjusted free cash
- $2.6B — from Q1 2023 Adjusted free cash flow up $2.6B or 30% from Q1 2023 Higher CCG revenu
- $8.5 billion — partment of Commerce has proposed up to $8.5 billion in direct funding and to make up to $11
- $11.0 billion — ion in direct funding and to make up to $11.0 billion in loans available under the CHIPS and
- $99,315 — ent, net of accumulated depreciation of $99,315 ($98,010 as of December 30, 2023) 99,92
- $98,010 — of accumulated depreciation of $99,315 ($98,010 as of December 30, 2023) 99,924 96,647
- $0.13 — 2 ) — ( 144 ) Cash dividends declared ($0.13 per share of common stock) — — — ( 529
Filing Documents
- intc-20240330.htm (10-Q) — 1356KB
- a03302024ex311.htm (EX-31.1) — 11KB
- a03302024ex312.htm (EX-31.2) — 11KB
- a03302024ex321.htm (EX-32.1) — 7KB
- intc-20240330_g1.jpg (GRAPHIC) — 24KB
- intc-20240330_g10.jpg (GRAPHIC) — 12KB
- intc-20240330_g11.jpg (GRAPHIC) — 14KB
- intc-20240330_g12.jpg (GRAPHIC) — 13KB
- intc-20240330_g13.jpg (GRAPHIC) — 15KB
- intc-20240330_g14.jpg (GRAPHIC) — 14KB
- intc-20240330_g15.jpg (GRAPHIC) — 16KB
- intc-20240330_g16.jpg (GRAPHIC) — 13KB
- intc-20240330_g17.jpg (GRAPHIC) — 15KB
- intc-20240330_g18.jpg (GRAPHIC) — 13KB
- intc-20240330_g19.jpg (GRAPHIC) — 37KB
- intc-20240330_g2.jpg (GRAPHIC) — 54KB
- intc-20240330_g20.jpg (GRAPHIC) — 16KB
- intc-20240330_g21.jpg (GRAPHIC) — 18KB
- intc-20240330_g22.jpg (GRAPHIC) — 17KB
- intc-20240330_g3.jpg (GRAPHIC) — 11KB
- intc-20240330_g4.jpg (GRAPHIC) — 15KB
- intc-20240330_g5.jpg (GRAPHIC) — 13KB
- intc-20240330_g6.jpg (GRAPHIC) — 14KB
- intc-20240330_g7.jpg (GRAPHIC) — 16KB
- intc-20240330_g8.jpg (GRAPHIC) — 17KB
- intc-20240330_g9.jpg (GRAPHIC) — 23KB
- 0000050863-24-000076.txt ( ) — 8211KB
- intc-20240330.xsd (EX-101.SCH) — 41KB
- intc-20240330_cal.xml (EX-101.CAL) — 94KB
- intc-20240330_def.xml (EX-101.DEF) — 230KB
- intc-20240330_lab.xml (EX-101.LAB) — 638KB
- intc-20240330_pre.xml (EX-101.PRE) — 430KB
- intc-20240330_htm.xml (XML) — 1129KB
Forward-Looking Statements
Forward-Looking Statements 1 Availability of Company Information 2 A Quarter in Review 3 Consolidated Condensed Financial Statements and Supplemental Details Consolidated Condensed Statements of Income 4 Consolidated Condensed Statements of Comprehensive Income 5 Consolidated Condensed Balance Sheets 6 Consolidated Condensed Statements of Cash Flows 7 Consolidated Condensed Statements of Stockholders' Equity 8 Notes to Consolidated Condensed Financial Statements 9 Key Terms 23
Management's Discussion and Analysis (MD&A)
Management's Discussion and Analysis (MD&A) Segment Trends and Results 24 Consolidated Condensed Results of Operations 30 Liquidity and Capital Resources 35 Non-GAAP Financial Measures 37 Risk Factors and Other Key Information Risk Factors 39
Quantitative and Qualitative Disclosures About Market Risk 39
Quantitative and Qualitative Disclosures About Market Risk 39
Controls and Procedures 39
Controls and Procedures 39 Issuer Purchases of Equity Securities 39 Rule 10b5-1 Trading Arrangements 39 Disclosure Pursuant to Section 13(r) of the Securities Exchange Act of 1934 40 Exhibits 41 Form 10-Q Cross-Reference Index 42 Table of Contents
Forward-Looking Statements
Forward-Looking Statements This Form 10-Q contains forward-looking statements that involve a number of risks and uncertainties. Words such as "accelerate", "achieve", "aim", "ambitions", "anticipate", "believe", "committed", "continue", "could", "designed", "estimate", "expect", "forecast", "future", "goals", "grow", "guidance", "intend", "likely", "may", "might", "milestones", "next generation", "objective", "on track", "opportunity", "outlook", "pending", "plan", "position", "possible", "potential", "predict", "progress", "ramp", "roadmap", "seek", "should", "strive", "targets", "to be", "upcoming", "will", "would", and variations of such words and similar expressions are intended to identify such forward-looking statements, which may include statements regarding: our business plans and strategy and anticipated benefits therefrom, including with respect to our IDM 2.0 strategy, Smart Capital strategy, partnership with Brookfield, internal foundry model, updated reporting structure, and AI strategy; projections of our future financial performance, including future revenue, gross margins, capital expenditures, and cash flows; projected costs and yield trends; future cash requirements, the availability, uses, sufficiency, and cost of capital resources, and sources of funding, including for future capital and R&D investments and for returns to stockholders, such as stock repurchases and dividends, and credit ratings expectations; future products, services, and technologies, and the expected goals, timeline, ramps, progress, availability, production, regulation, and benefits of such products, services, and technologies, including future process nodes and packaging technology, product roadmaps, schedules, future product architectures, expectations regarding process performance, per-watt parity, and metrics, and expectations regarding product and process leadership; investment plans and impacts of investment plans, including in the US and abroad; internal and ext
Financial Statements Consolidated Condensed Statements of Income 4
Financial Statements Consolidated Condensed Statements of Income 4 Table of Contents Consolidated Condensed Statements of Comprehensive Income Three Months Ended (In Millions; Unaudited) Mar 30, 2024 Apr 1, 2023 Net income (loss) $ ( 437 ) $ ( 2,768 ) Changes in other comprehensive income (loss), net of tax: Net unrealized holding gains (losses) on derivatives ( 328 ) 142 Actuarial valuation and other pension benefits (expenses), net — 1 Translation adjustments and other 1 — Other comprehensive income (loss) ( 327 ) 143 Total comprehensive income (loss) ( 764 ) ( 2,625 ) Less: comprehensive income (loss) attributable to non-controlling interests ( 56 ) ( 10 ) Total comprehensive income (loss) attributable to Intel $ ( 708 ) $ ( 2,615 ) See accompanying notes.
Financial Statements Consolidated Condensed Statements of Comprehensive Income 5
Financial Statements Consolidated Condensed Statements of Comprehensive Income 5 Table of Contents Consolidated Condensed Balance Sheets (In Millions; Unaudited) Mar 30, 2024 Dec 30, 2023 Assets Current assets: Cash and cash equivalents $ 6,923 $ 7,079 Short-term investments 14,388 17,955 Accounts receivable, net 3,323 3,402 Inventories 11,494 11,127 Other current assets 6,480 3,706 Total current assets 42,608 43,269 Property, plant, and equipment, net of accumulated depreciation of $99,315 ($98,010 as of December 30, 2023) 99,924 96,647 Equity investments 6,139 5,829 Goodwill 27,440 27,591 Identified intangible assets, net 4,675 4,589 Other long-term assets 11,947 13,647 Total assets $ 192,733 $ 191,572 Liabilities and stockholders' equity Current liabilities: Short-term debt $ 4,581 $ 2,288 Accounts payable 8,559 8,578 Accrued compensation and benefits 2,506 3,655 Income taxes payable 346 1,107 Other accrued liabilities 11,221 12,425 Total current liabilities 27,213 28,053 Debt 47,869 46,978 Other long-term liabilities 6,895 6,576 Contingencies (Note 13) Stockholders' equity: Common stock and capital in excess of par value, 4,257 issued and outstanding (4,228 issued and outstanding as of December 30, 2023) 38,291 36,649 Accumulated other comprehensive income (loss) ( 542 ) ( 215 ) Retained earnings 68,224 69,156 Total Intel stockholders' equity 105,973 105,590 Non-controlling interests 4,783 4,375 Total stockholders' equity 110,756 109,965 Total liabilities and stockholders' equity $ 192,733 $ 191,572 See accompanying notes.
Financial Statements Consolidated Condensed Balance Sheets 6
Financial Statements Consolidated Condensed Balance Sheets 6 Table of Contents Consolidated Condensed Statements of Cash Flows Three Months Ended (In Millions; Unaudited) Mar 30, 2024 Apr 1, 2023 Cash and cash equivalents, beginning of period $ 7,079 $ 11,144 Cash flows provided by (used for) operating activities: Net income (loss) ( 437 ) ( 2,768 ) Adjustments to reconcile net income (loss) to net cash provided by operating activities: Depreciation 2,200 1,901 Share-based compensation 1,179 739 Restructuring and other charges 348 55 Amortization of intangibles 351 465 (Gains) losses on equity investments, net ( 208 ) ( 167 ) Changes in assets and liabilities: Accounts receivable 80 286 Inventories ( 366 ) 231 Accounts payable ( 386 ) ( 771 ) Accrued compensation and benefits ( 1,289 ) ( 1,560 ) Income taxes ( 591 ) 1,344 Other assets and liabilities ( 2,104 ) ( 1,540 ) Total adjustments ( 786 ) 983 Net cash provided by (used for) operating activities ( 1,223 ) ( 1,785 ) Cash flows provided by (used for) investing activities: Additions to property, plant, and equipment ( 5,970 ) ( 7,413 ) Proceeds from capital-related government incentives 592 — Purchases of short-term investments ( 6,460 ) ( 16,132 ) Maturities and sales of short-term investments 9,598 14,173 Other investing ( 323 ) 851 Net cash provided by (used for) investing activities ( 2,563 ) ( 8,521 ) Cash flows provided by (used for) financing activities: Issuance of commercial paper, net of issuance costs 793 — Repayment of commercial paper — ( 2,930 ) Payments on finance leases — ( 15 ) Partner contributions 423 449 Issuance of long-term debt, net of issuance costs 2,537 10,968 Proceeds from sales of common stock through employee equity incentive plans 626 659 Payment of dividends to stockholders ( 529 ) ( 1,512 ) Other financing ( 220 ) ( 225 ) Net cash provided by (used for) financing activities 3,630 7,394 Net increase (decrease) in cash and cash
Financial Statements Consolidated Condensed Statements of Cash Flows 7
Financial Statements Consolidated Condensed Statements of Cash Flows 7 Table of Contents Consolidated Condensed Statements of Stockholders' Equity (In Millions, Except Per Share Amounts; Unaudited) Common Stock and Capital in Excess of Par Value Accumulated Other Comprehensive Income (Loss) Retained Earnings Non-Controlling Interests Total Shares Amount Three Months Ended Balance as of December 30, 2023 4,228 $ 36,649 $ ( 215 ) $ 69,156 $ 4,375 $ 109,965 Net income (loss) — — — ( 381 ) ( 56 ) ( 437 ) Other comprehensive income (loss) — — ( 327 ) — — ( 327 ) Net proceeds from partner contributions — — — — 423 423 Employee equity incentive plans and other 32 626 — — — 626 Share-based compensation — 1,138 — — 41 1,179 Restricted stock unit withholdings ( 3 ) ( 122 ) — ( 22 ) — ( 144 ) Cash dividends declared ($0.13 per share of common stock) — — — ( 529 ) — ( 529 ) Balance as of March 30, 2024 4,257 $ 38,291 $ ( 542 ) $ 68,224 $ 4,783 $ 110,756 Balance as of December 31, 2022 4,137 $ 31,580 $ ( 562 ) $ 70,405 $ 1,863 $ 103,286 Net income (loss) — — — ( 2,758 ) ( 10 ) ( 2,768 ) Other comprehensive income (loss) — — 143 — — 143 Net proceeds from partner contributions — — — — 449 449 Employee equity incentive plans and other 36 659 — — — 659 Share-based compensation — 697 — — 42 739 Restricted stock unit withholdings ( 2 ) ( 107 ) — 38 — ( 69 ) Cash dividends declared ($0.49 per share of common stock) — — — ( 2,036 ) — ( 2,036 ) Balance as of April 1, 2023 4,171 $ 32,829 $ ( 419 ) $ 65,649 $ 2,344 $ 100,403 See accompanying notes.
Financial Statements Consolidated Condensed Statements of Stockholders' Equity 8
Financial Statements Consolidated Condensed Statements of Stockholders' Equity 8 Table of Contents Notes to Consolidated Condensed Financial Statements Note 1 : Basis of Presentation We prepared our interim Consolidated Condensed Financial Statements that accompany these notes in conformity with US GAAP, consistent in all material respects with those applied in our 2023 Form 10-K. We have made estimates and judgments affecting the amounts reported in our Consolidated Condensed Financial Statements and the accompanying notes. The actual results that we experience may differ materially from our estimates. The interim financial information is unaudited, and reflects all normal adjustments that are, in our opinion, necessary to provide a fair statement of results for the interim periods presented. This report should be read in conjunction with our 2023 Form 10-K where we include additional information on our critical accounting estimates, policies, and the methods and assumptions used in our estimates. Note 2 : Operating Segments We previously announced the implementation of our internal foundry operating model, which took effect in the first quarter of 2024, and creates a foundry relationship between our Intel Products business (collectively CCG, DCAI, and NEX) and our Intel Foundry business. Intel Products consists substantially of design and development of CPUs and related solutions for third party customers. Intel Foundry consists substantially of process engineering, manufacturing, and foundry services groups that provide manufacturing, test, and assembly services to our Intel Products business and to third party customers. Both businesses utilize marketing, sales, and other support functions. Our internal foundry model is a key component of our strategy and is designed to reshape our operational dynamics and drive greater transparency, accountability, and focus on costs and efficiency. We also previously announced our intent to operate Altera, an Int
Financial Statements Notes to Financial Statements 9
Financial Statements Notes to Financial Statements 9 Table of Contents Intel Foundry Segment revenue : consists substantially of intersegment product and services revenue for wafer fabrication and related products and services sold to Intel Products, Altera, and certain other Intel internal businesses. We recognize intersegment revenue when we satisfy performance obligations as evidenced by the transfer of control of Intel Foundry products and services to the Intel Products businesses, which is generally at the completion of wafer sorting and at the completion of assembly and test services. Intersegment sales are recorded at prices that are intended to approximate market pricing. Intel Foundry also includes certain third party foundry and assembly and test revenues from external customers that were $ 27 million in first three months of 2024 and $ 118 million in the first three months of 2023. Segment expenses: consists of direct expenses for technology development, product manufacturing and services provided by Intel Foundry to internal and external customers, allocated expenses as described below, and direct operating expenses. Direct expenses for product manufacturing includes excess capacity charges that were previously allocated primarily to CCG, DCAI, and NEX. All other: Altera & Mobileye Segment revenue: consists of product revenues from third party customers. Altera revenue is derived from programmable semiconductors, primarily FPGAs, CPLDs, acceleration platforms, software, IP, and related products. Mobileye revenue is derived from advanced driver-assistance systems (ADAS) and autonomous driving technologies and solutions. Segment expenses: Altera expenses consist of intersegment charges for product manufacturing and related services from Intel Foundry, third party manufacturing, allocated expenses as described below, and direct operating expenses. Mobileye expenses consists of third party direct expenses for product manufacturing and related servic