Navient Corp. Files 10-Q for Period Ending March 31, 2024
Ticker: JSM · Form: 10-Q · Filed: Apr 24, 2024 · CIK: 1593538
| Field | Detail |
|---|---|
| Company | Navient Corp (JSM) |
| Form Type | 10-Q |
| Filed Date | Apr 24, 2024 |
| Risk Level | medium |
| Pages | 14 |
| Reading Time | 17 min |
| Key Dollar Amounts | $35.9 billion, $16.6 billion, $259 million, $1 billion, $247 million |
| Sentiment | neutral |
Sentiment: neutral
Topics: Navient, 10-Q, Student Loans, Financial Instruments, Fair Value
TL;DR
<b>Navient Corp. filed its Q1 2024 10-Q, detailing financial instruments, loan portfolios, and fair value measurements.</b>
AI Summary
NAVIENT CORP (JSM) filed a Quarterly Report (10-Q) with the SEC on April 24, 2024. Navient Corp. filed a 10-Q report for the period ending March 31, 2024. The filing includes data related to various financial instruments and loan portfolios. Specific mentions include 'PrivateEducationLoansMember', 'SchoolGraceDefermentMember', and 'FederalFamilyEducationLoanProgramFfelpGuaranteedLoansMember'. Fair value measurements and related inputs are detailed, including 'FairValueInputsLevel2Member' and 'FairValueInputsLevel3Member'. The report references financial metrics such as 'InterestExpenseMember' and 'RetainedEarningsMember'.
Why It Matters
For investors and stakeholders tracking NAVIENT CORP, this filing contains several important signals. This 10-Q provides a detailed look into Navient's financial health and operational specifics for the first quarter of 2024, crucial for investors assessing current performance and future outlook. The extensive data on loan types, credit risk, and derivative instruments offers insights into the company's risk exposure and management strategies in the student loan servicing sector.
Risk Assessment
Risk Level: medium — NAVIENT CORP shows moderate risk based on this filing. The filing contains numerous specific financial and operational details, including various loan types and fair value measurements, indicating a medium level of complexity and potential risk.
Analyst Insight
Investors should review the detailed breakdown of loan portfolios and fair value measurements to understand Navient's current financial standing and risk exposure.
Key Numbers
- 2024-03-31 — Period End Date (CONFORMED PERIOD OF REPORT)
- 2024-04-24 — Filing Date (FILED AS OF DATE)
- 2023-12-31 — Previous Year End Date (us-gaap:InterestRateFloorMember)
- 2023-03-31 — Previous Year Q1 End Date (navi:FicoMember)
Key Players & Entities
- NAVIENT CORP (company) — FILER
- JSM (company) — tk
- 2024-03-31 (date) — CONFORMED PERIOD OF REPORT
- 2024-04-24 (date) — FILED AS OF DATE
- 13865 SUNRISE VALLEY DRIVE (address) — BUSINESS ADDRESS
- HERNDON (city) — BUSINESS ADDRESS
- VA (state) — BUSINESS ADDRESS
- 20171 (zip) — BUSINESS ADDRESS
FAQ
When did NAVIENT CORP file this 10-Q?
NAVIENT CORP filed this Quarterly Report (10-Q) with the SEC on April 24, 2024.
What is a 10-Q filing?
A 10-Q is a quarterly financial report with unaudited financials, management discussion, and interim business updates. This particular 10-Q was filed by NAVIENT CORP (JSM).
Where can I read the original 10-Q filing from NAVIENT CORP?
You can access the original filing directly on the SEC's EDGAR system. The filing is publicly available and includes all exhibits and attachments submitted by NAVIENT CORP.
What are the key takeaways from NAVIENT CORP's 10-Q?
NAVIENT CORP filed this 10-Q on April 24, 2024. Key takeaways: Navient Corp. filed a 10-Q report for the period ending March 31, 2024.. The filing includes data related to various financial instruments and loan portfolios.. Specific mentions include 'PrivateEducationLoansMember', 'SchoolGraceDefermentMember', and 'FederalFamilyEducationLoanProgramFfelpGuaranteedLoansMember'..
Is NAVIENT CORP a risky investment based on this filing?
Based on this 10-Q, NAVIENT CORP presents a moderate-risk profile. The filing contains numerous specific financial and operational details, including various loan types and fair value measurements, indicating a medium level of complexity and potential risk.
What should investors do after reading NAVIENT CORP's 10-Q?
Investors should review the detailed breakdown of loan portfolios and fair value measurements to understand Navient's current financial standing and risk exposure. The overall sentiment from this filing is neutral.
Risk Factors
- Credit Concentration Risk [medium — financial]: The company faces credit concentration risk related to its accounts receivable, specifically private education loans and FFELP guaranteed loans.
- Fair Value Measurements [medium — financial]: The company utilizes various valuation techniques, including discounted cash flow, and inputs such as constant prepayment rates and discount for lack of marketability, for its financial instruments.
- Derivative Instruments [medium — financial]: Navient engages in derivative contracts, including cross-currency interest rate contracts and interest rate swaps, which are subject to market fluctuations and valuation risks.
Key Dates
- 2024-03-31: Quarterly Period End — Reporting period for the 10-Q filing.
- 2024-04-24: Filing Date — Date the 10-Q was officially submitted to the SEC.
Glossary
- PrivateEducationLoansMember
- Refers to private education loans held by the company. (Indicates a specific segment of Navient's loan portfolio, relevant for assessing credit risk and revenue.)
Filing Stats: 4,324 words · 17 min read · ~14 pages · Grade level 14.7 · Accepted 2024-04-24 16:28:07
Key Financial Figures
- $35.9 billion — Education Loans We own a portfolio of $35.9 billion of federally guaranteed Federal Family
- $16.6 billion — ent loans and refinancing products. Our $16.6 billion Private Education Loan portfolio demons
- $259 million — er of 2024, we originated approximately $259 million of Private Education Loans. Business
- $1 billion — ogram authorizing the purchase of up to $1 billion of the Company's outstanding common sto
- $247 million — anding common stock. At March 31, 2024, $247 million remained in share repurchase authorizat
- $73 million — First-quarter 2024 GAAP net income was $73 million ($0.64 diluted earnings per share), com
- $0.64 — r 2024 GAAP net income was $73 million ($0.64 diluted earnings per share), compared w
- $111 million — uted earnings per share), compared with $111 million ($0.86 diluted earnings per share) for
- $0.86 — per share), compared with $111 million ($0.86 diluted earnings per share) for the yea
- $54 million — arter 2024 Core Earnings net income was $54 million ($0.47 diluted Core Earnings per share)
- $0.47 — re Earnings net income was $54 million ($0.47 diluted Core Earnings per share), compa
- $133 million — Core Earnings per share), compared with $133 million ($1.02 diluted Core Earnings per share)
- $1.02 — per share), compared with $133 million ($1.02 diluted Core Earnings per share) for th
- $23 million — ed a net reduction to pre-tax income of $23 million ($0.16 diluted loss per share) comprise
- $0.16 — ction to pre-tax income of $23 million ($0.16 diluted loss per share) comprised of th
Filing Documents
- navi-20240331.htm (10-Q) — 7401KB
- navi-ex10_1.htm (EX-10.1) — 73KB
- navi-ex31_1.htm (EX-31.1) — 13KB
- navi-ex31_2.htm (EX-31.2) — 13KB
- navi-ex32_1.htm (EX-32.1) — 7KB
- navi-ex32_2.htm (EX-32.2) — 8KB
- img127487720_0.jpg (GRAPHIC) — 121KB
- img127487720_1.jpg (GRAPHIC) — 360KB
- img127487720_2.jpg (GRAPHIC) — 216KB
- 0000950170-24-047619.txt ( ) — 27979KB
- navi-20240331.xsd (EX-101.SCH) — 1812KB
- navi-20240331_htm.xml (XML) — 7277KB
Business
Business 3 Overview and Fundamentals of Our Business 3 Recent Business Developments 5 How We Organize Our Business 5
Management's Discussion and Analysis of Financial Condition and Results of Operations
Management's Discussion and Analysis of Financial Condition and Results of Operations 7 Selected Historical Financial Information and Ratios 7 The Quarter in Review 8 Results of Operations 9 Segment Results 11 Financial Condition 18 Liquidity and Capital Resources 22 Critical Accounting Policies and Estimates 25 Non-GAAP Financial Measures 25
Legal Proceedings
Legal Proceedings 33
Quantitative and Qualitative Disclosures about Market Risk
Quantitative and Qualitative Disclosures about Market Risk 35 Purchases of Equity Securities by the Issuer and Affiliated Purchasers 38
Controls and Procedures
Controls and Procedures 40 Exhibits 41
Financial Statements
Financial Statements 42
Signatures
Signatures 76 Appendix A – Form 10-Q Cross-Reference Index 77 FORWARD-LOOKING AND CAUTIONARY STATEMENTS This Form 10-Q contains "forward-looking" statements and other information that is based on management's current expectations as of the date of this report. Statements that are not historical facts, including statements about our beliefs, opinions, or expectations and statements that assume or are dependent upon future events, are forward-looking statements and often contain words such as "expect," "anticipate," "intend," "plan," "believe," "seek," "see," "will," "would," "may," "could," "should," "goals," or "target." Such statements are based on management's expectations as of the date of this filing and involve many risks and uncertainties that could cause our actual results to differ materially from those expressed or implied in our forward-looking statements. Such risks and uncertainties are discussed more fully under the section titled "Risk Factors" and include, but are not limited to the following: general economic conditions, including the potential impact of inflation and interest rates on Navient and its clients and customers and on the creditworthiness of third parties; increased defaults on education loans held by us; unanticipated repayment trends on education loans including prepayments or deferrals resulting from new interpretations or the timing of the execution and implementation of current laws, rules or regulations or future laws, executive orders or other policy initiatives that operate to encourage or require consolidation, abolish existing or create additional income-based repayment or debt forgiveness programs or establish other policies and programs or extensions of previously announced deadlines which may increase or decrease the prepayment rates on education loans and accelerate or slow down the repayment of the bonds in our securitization trusts; a reduction in our credit ratings; changes to applicable laws, rules, r
Business
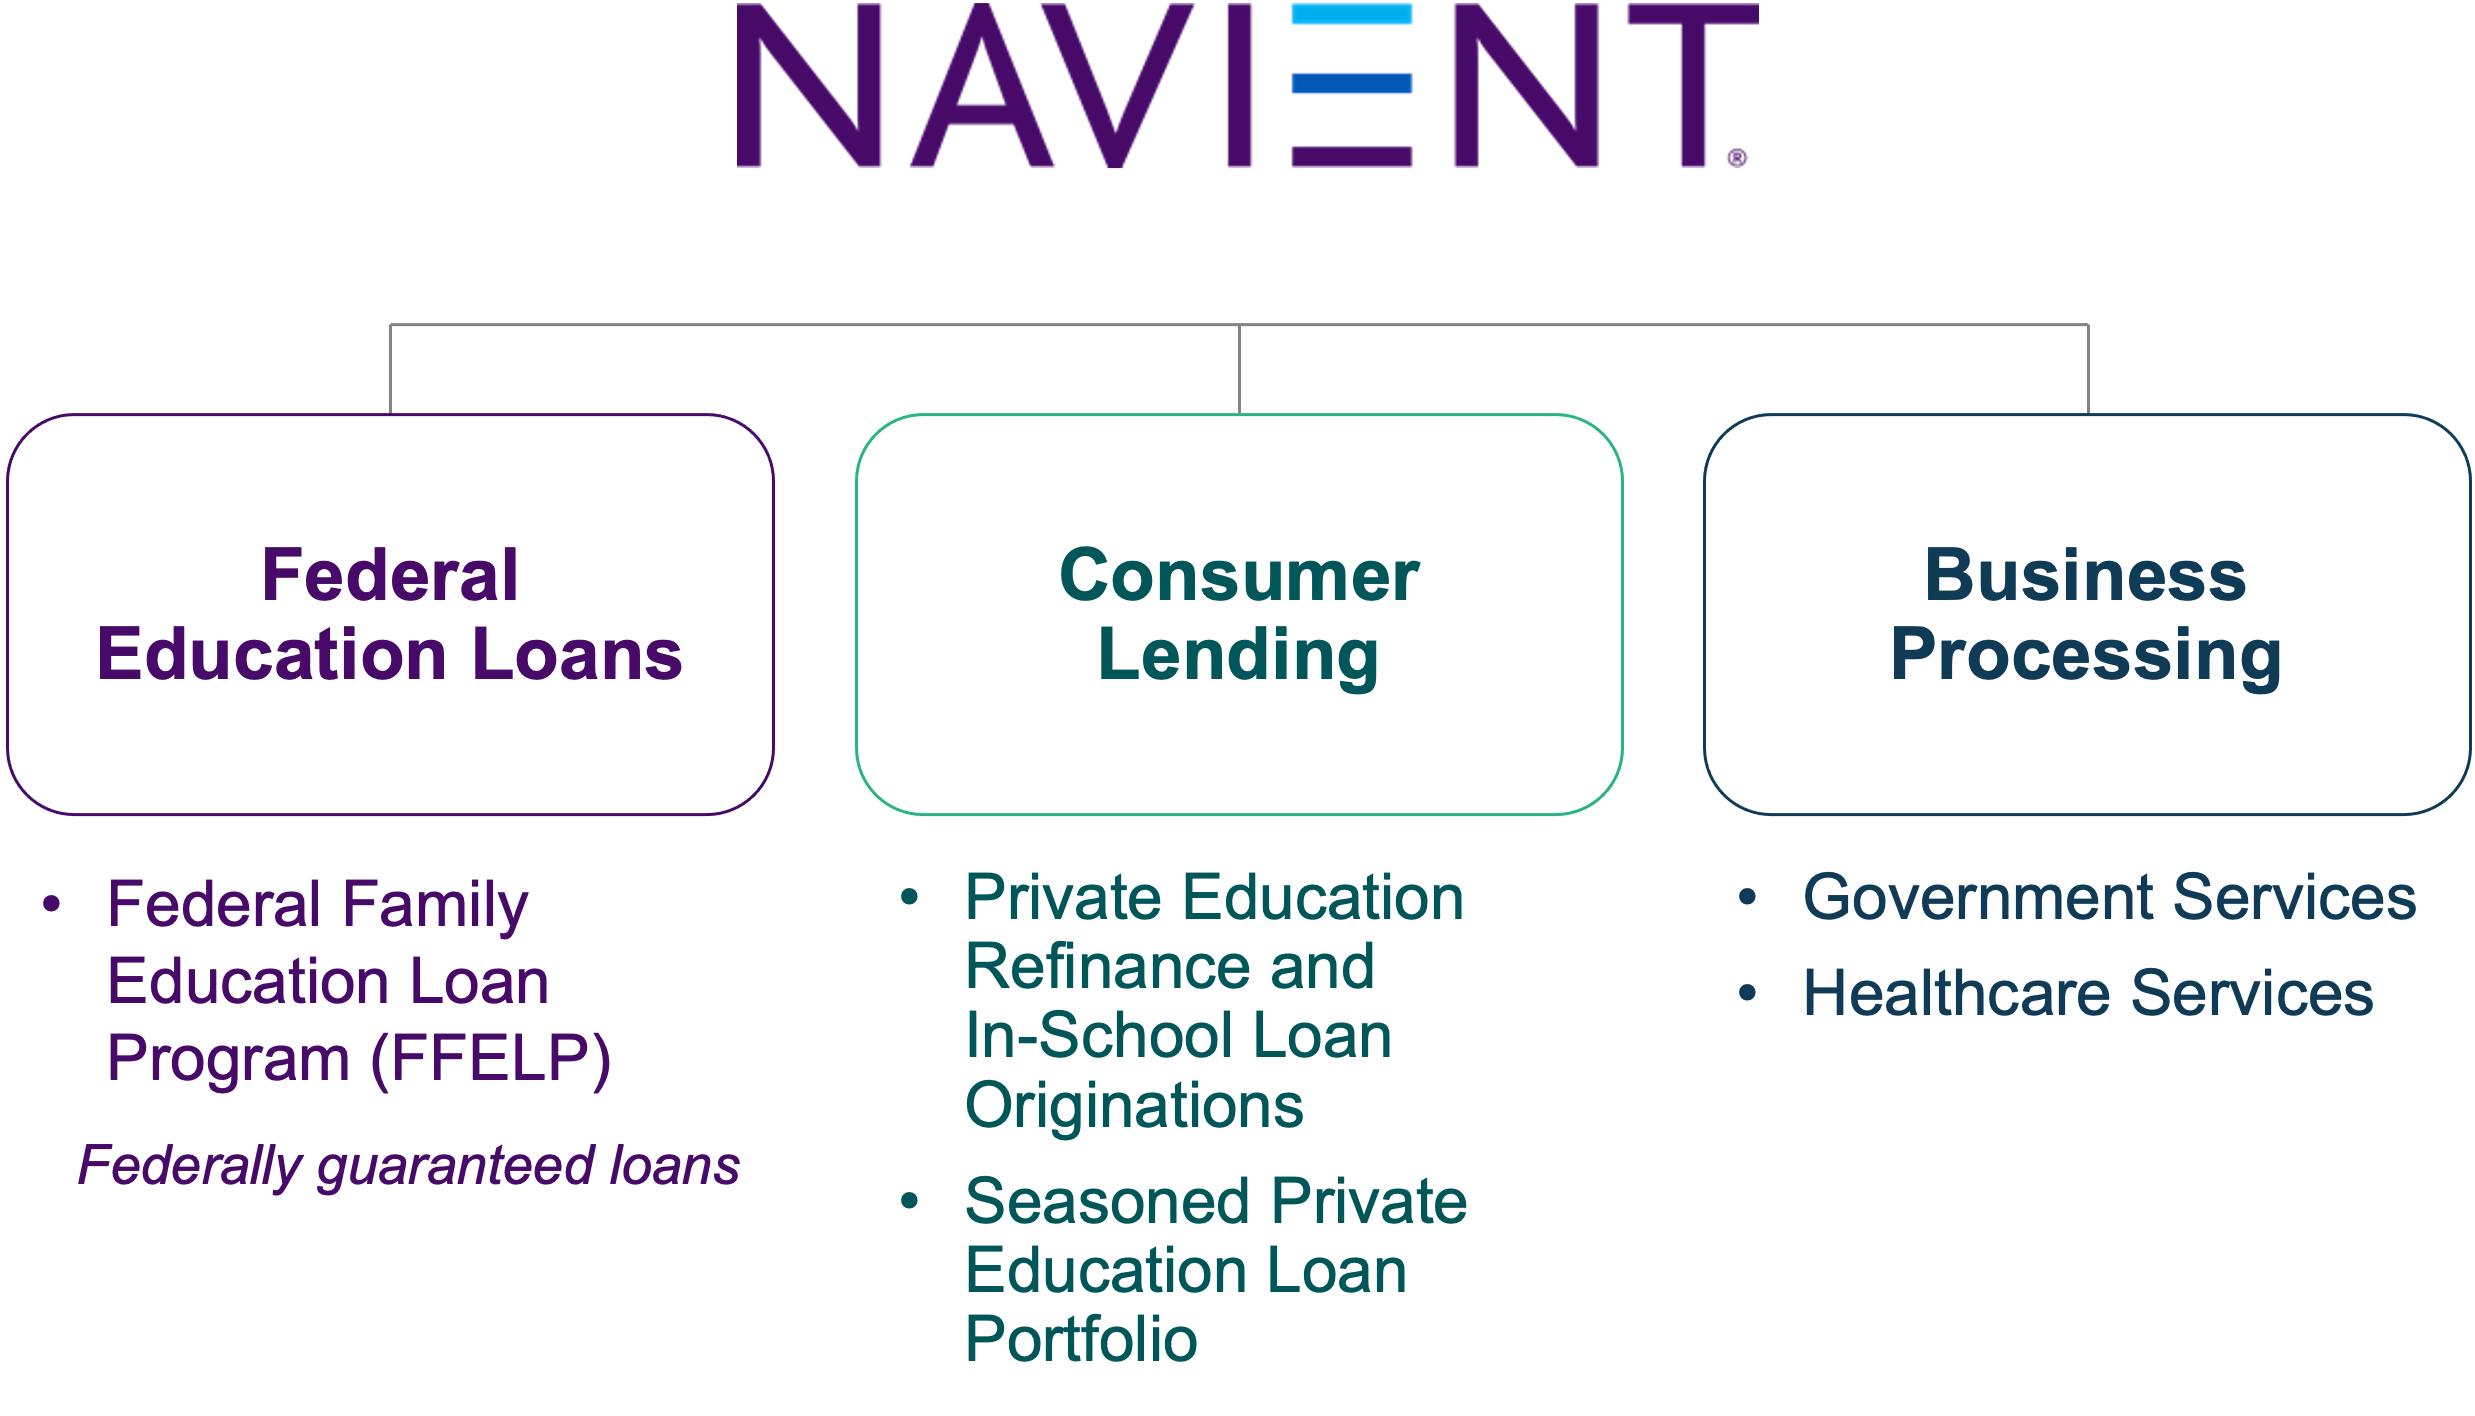
Business O verview and Fundamentals of Our Business Navient (Nasdaq: NAVI) provides technology-enabled education finance and business processing solutions that simplify complex programs and help millions of people achieve success. Our customer-focused, data-driven services deliver exceptional results for clients in education, health care and government. Learn more at navient.com. With a focus on data-driven insights, service, compliance and innovative support, Navient's business consists of: Federal Education Loans We own a portfolio of $35.9 billion of federally guaranteed Federal Family Education Loan Program (FFELP) Loans. As a servicer on our own portfolio and for third parties, we deploy data-driven approaches to support the success of our customers. Our flexible and scalable infrastructure manages large volumes of complex transactions, simplifying the customer experience and continually improving efficiency. Consumer Lending We help students and families succeed through the college journey with innovative planning tools, student loans and refinancing products. Our $16.6 billion Private Education Loan portfolio demonstrates high customer success rates. In the first quarter of 2024, we originated approximately $259 million of Private Education Loans. Business Processing We leverage our loan servicing expertise to provide business processing solutions for approximately 500 public sector and healthcare organizations, and their tens of millions of clients, patients, and constituents. Our suite of omnichannel customer experience, digital processing and revenue cycle solutions enables our clients to deliver better results for the people they serve. Superior Operational Performance with a Strong Customer Service and Compliance Commitment We help our customers — both individuals and institutions — navigate the path to financial success through proactive, data-driven, simplified service and innovative solutions. Delivering superior performance .
Management's Discussion and Analysis of Financial Condition and Results of Operations
Management's Discussion and Analysis of Financial Condition and Results of Operations S elected Historical Financial Information and Ratios Three Months Ended March 31, (In millions, except per share data) 2024 2023 GAAP Basis Net income $ 73 $ 111 Diluted earnings per common share $ .64 $ .86 Weighted average shares used to compute diluted earnings per share 114 130 Return on common stockholders' equity .51 % .68 % Core Earnings Basis (1) Net income (1) $ 54 $ 133 Diluted earnings per common share (1) $ .47 $ 1.02 Weighted average shares used to compute diluted earnings per share 114 130 Net interest margin, Federal Education Loans segment .55 % 1.12 % Net interest margin, Consumer Lending segment 2.99 % 3.12 % Return on assets .37 % .82 % Education Loan Portfolios Ending FFELP Loans, net $ 35,879 $ 42,148 Ending Private Education Loans, net 16,608 18,275 Ending total education loans, net $ 52,487 $ 60,423 Average FFELP Loans $ 37,158 $ 43,263 Average Private Education Loans 17,385 19,289 Average total education loans $ 54,543 $ 62,552 (1) Item is a non-GAAP financial measure. For a description and reconciliation, see "Non-GAAP Financial Measures — Core Earnings." 7 T he Quarter i n Review We prepare financial statements and present financial results in accordance with GAAP. However, we also evaluate our business segments and present financial results on a basis that differs from GAAP. We refer to this different basis of presentation as Core Earnings. We provide this Core Earnings basis of presentation on a consolidated basis and for each business segment because this is what we review internally when making management decisions regarding our performance and how we allocate resources. We also include this information in our presentations with credit rating agencies, lenders and investors. Because our