Medtronic plc Files Q1 FY25 10-Q Report
Ticker: MDT · Form: 10-Q · Filed: Aug 27, 2024 · CIK: 1613103
| Field | Detail |
|---|---|
| Company | Medtronic PLC (MDT) |
| Form Type | 10-Q |
| Filed Date | Aug 27, 2024 |
| Risk Level | low |
| Pages | 16 |
| Reading Time | 19 min |
| Key Dollar Amounts | $0.0001, $0 |
| Sentiment | neutral |
Sentiment: neutral
Topics: 10-Q, quarterly-report, medtronic
TL;DR
Medtronic dropped its Q1 FY25 10-Q. Check financials.
AI Summary
Medtronic plc filed its 10-Q for the period ending July 26, 2024. The filing covers the first quarter of fiscal year 2025. Key financial details and operational updates are provided, though specific dollar amounts for revenue or profit are not immediately apparent in this header information.
Why It Matters
This filing provides investors with an update on Medtronic's financial performance and operational status for the first quarter of fiscal year 2025, crucial for understanding the company's trajectory.
Risk Assessment
Risk Level: low — This is a routine quarterly filing providing financial updates, not indicating immediate significant risks.
Key Numbers
- Q1 2025 — Fiscal Quarter (Reporting period for the 10-Q)
Key Players & Entities
- Medtronic plc (company) — Filer of the 10-Q report
- 20240726 (date) — End of the reporting period
- 20240827 (date) — Date of filing
- 0001613103-24-000147 (other) — Accession number for the filing
FAQ
What is the reporting period for this 10-Q filing?
The reporting period for this 10-Q filing is the quarter ended July 26, 2024.
When was this 10-Q filed with the SEC?
This 10-Q was filed on August 27, 2024.
What is Medtronic plc's Central Index Key (CIK)?
Medtronic plc's Central Index Key is 0001613103.
What is Medtronic's fiscal year end?
Medtronic's fiscal year ends on April 25th.
What is the SEC file number for Medtronic plc?
The SEC file number for Medtronic plc is 001-36820.
Filing Stats: 4,805 words · 19 min read · ~16 pages · Grade level 14.9 · Accepted 2024-08-27 16:18:26
Key Financial Figures
- $0.0001 — registered Ordinary shares, par value $0.0001 per share MDT New York Stock Exchange
- $0 — ,282,490,493 ordinary shares, par value $0.0001, of the registrant were outstandin
Filing Documents
- mdt-20240726.htm (10-Q) — 1809KB
- mdt-2025q110qxex311.htm (EX-31.1) — 10KB
- mdt-2025q110qxex312.htm (EX-31.2) — 11KB
- mdt-2025q110qxex321.htm (EX-32.1) — 5KB
- mdt-2025q110qxex322.htm (EX-32.2) — 5KB
- mdt-20240726_g1.jpg (GRAPHIC) — 55KB
- mdt-20240726_g10.jpg (GRAPHIC) — 40KB
- mdt-20240726_g11.jpg (GRAPHIC) — 35KB
- mdt-20240726_g12.jpg (GRAPHIC) — 35KB
- mdt-20240726_g13.jpg (GRAPHIC) — 81KB
- mdt-20240726_g2.jpg (GRAPHIC) — 150KB
- mdt-20240726_g3.jpg (GRAPHIC) — 51KB
- mdt-20240726_g4.jpg (GRAPHIC) — 52KB
- mdt-20240726_g5.jpg (GRAPHIC) — 37KB
- mdt-20240726_g6.jpg (GRAPHIC) — 37KB
- mdt-20240726_g7.jpg (GRAPHIC) — 40KB
- mdt-20240726_g8.jpg (GRAPHIC) — 40KB
- mdt-20240726_g9.jpg (GRAPHIC) — 41KB
- 0001613103-24-000147.txt ( ) — 12744KB
- mdt-20240726.xsd (EX-101.SCH) — 70KB
- mdt-20240726_cal.xml (EX-101.CAL) — 107KB
- mdt-20240726_def.xml (EX-101.DEF) — 388KB
- mdt-20240726_lab.xml (EX-101.LAB) — 843KB
- mdt-20240726_pre.xml (EX-101.PRE) — 610KB
- mdt-20240726_htm.xml (XML) — 2045KB
— FINANCIAL INFORMATION
PART I — FINANCIAL INFORMATION
Financial Statements
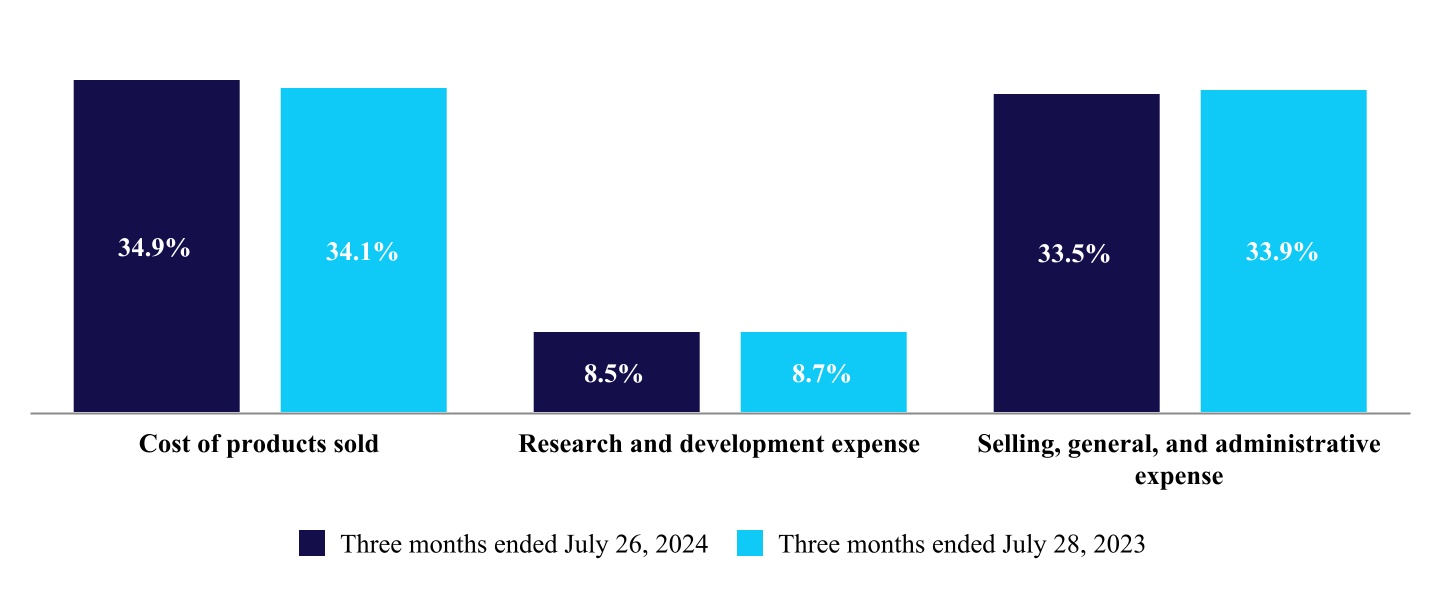
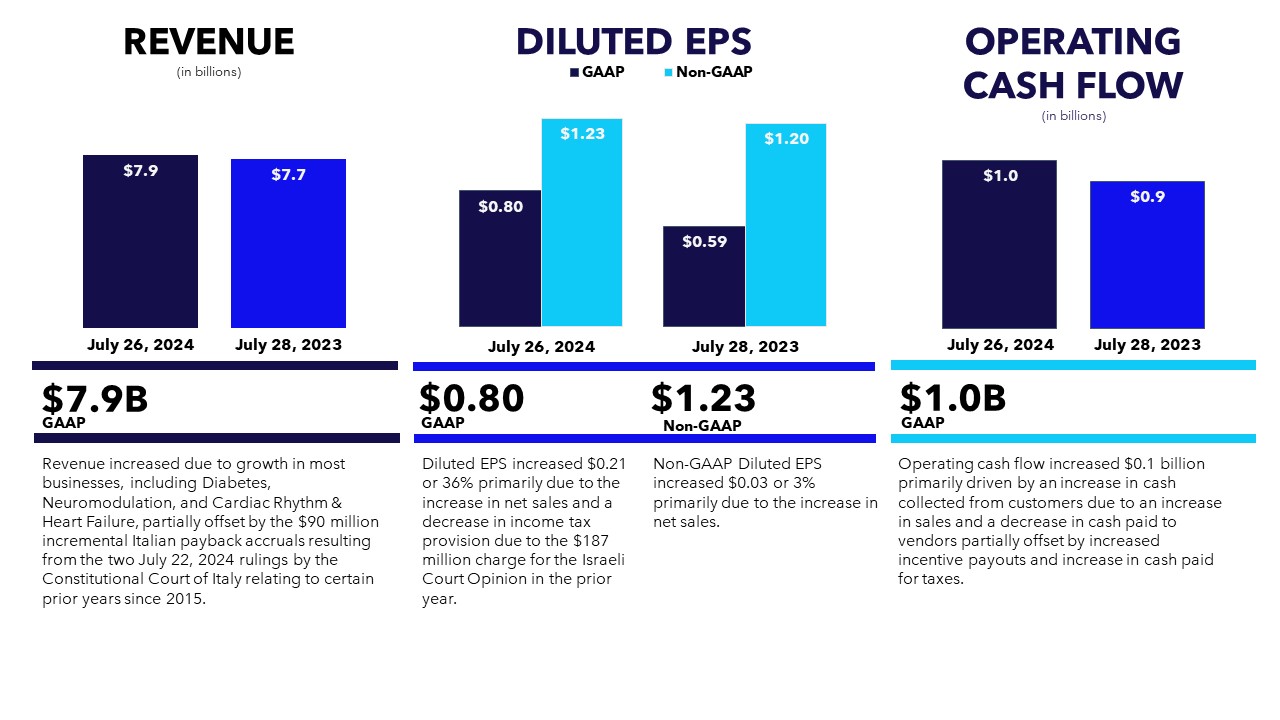
Item 1. Financial Statements Medtronic plc Consolidated Statements of Income (Unaudited) Three months ended (in millions, except per share data) July 26, 2024 July 28, 2023 Net sales $ 7,915 $ 7,702 Costs and expenses: Cost of products sold, excluding amortization of intangible assets 2,761 2,628 Research and development expense 676 668 Selling, general, and administrative expense 2,655 2,613 Amortization of intangible assets 414 429 Restructuring charges, net 47 54 Certain litigation charges, net 81 40 Other operating expense, net 1 1 Operating profit 1,278 1,268 Other non-operating income, net ( 157 ) ( 76 ) Interest expense, net 167 148 Income before income taxes 1,268 1,196 Income tax provision 220 400 Net income 1,049 797 Net income attributable to noncontrolling interests ( 6 ) ( 6 ) Net income attributable to Medtronic $ 1,042 $ 791 Basic earnings per share $ 0.81 $ 0.59 Diluted earnings per share $ 0.80 $ 0.59 Basic weighted average shares outstanding 1,293.3 1,330.5 Diluted weighted average shares outstanding 1,296.5 1,333.8 The accompanying notes are an integral part of these consolidated financial statements . 1 Medtronic plc Consolidated Statements of Comprehensive Income (Unaudited) Three months ended (in millions) July 26, 2024 July 28, 2023 Net income $ 1,049 $ 797 Other comprehensive income (loss), net of tax: Unrealized gain (loss) on investment securities 76 ( 19 ) Translation adjustment 102 14 Net investment hedge ( 206 ) ( 143 ) Net change in retirement obligations 1 3 Unrealized loss on cash flow hedges ( 66 ) ( 30 ) Other comprehensive loss ( 92 ) ( 175 ) Comprehensive income including noncontrolling interests 957 622 Comprehensive income attributable to noncontrolling interests ( 6 ) ( 6 ) Comprehensive income attributable to Medtronic $ 950 $ 616 The accompanying notes are an integral part of these consolidated financial statements. 2 Medtronic plc Consolidated Balance Sheets (Unaudited)
Notes to Consolidated Financial Statements
Notes to Consolidated Financial Statements (Unaudited) 1. Basis of Presentation The accompanying unaudited consolidated financial statements of Medtronic plc and its subsidiaries (Medtronic plc, Medtronic, or the Company) have been prepared in accordance with accounting principles generally accepted in the United States of America (U.S.) (U.S. GAAP) for interim financial information and with the instructions to Form 10-Q and Article 10 of Regulation S-X. In the opinion of management, the consolidated financial statements include all the adjustments necessary for a fair statement in conformity with U.S. GAAP. Certain reclassifications have been made to prior year financial statements to conform to classifications used in the current year. Operating results for interim periods are not necessarily indicative of results that may be expected for the fiscal year as a whole. The preparation of the financial statements in conformity with U.S. GAAP requires management to make estimates and assumptions that affect the reported amounts of assets, liabilities, revenues, expenses, and the related disclosures at the date of the financial statements and during the reporting period. Actual results could materially differ from these estimates. The accompanying unaudited consolidated financial statements include the accounts of Medtronic plc, its wholly-owned subsidiaries, entities for which the Company has a controlling financial interest, and variable interest entities for which the Company is the primary beneficiary. Intercompany transactions and balances have been eliminated in consolidation. Amounts reported in millions within this quarterly report are computed based on the amounts in thousands, and therefore, the sum of the components may not equal the total amount reported in millions due to rounding. Additionally, certain columns and rows within tables may not sum due to rounding. The accompanying unaudited consolidated financial statements and related notes should be
Notes to Consolidated Financial Statements
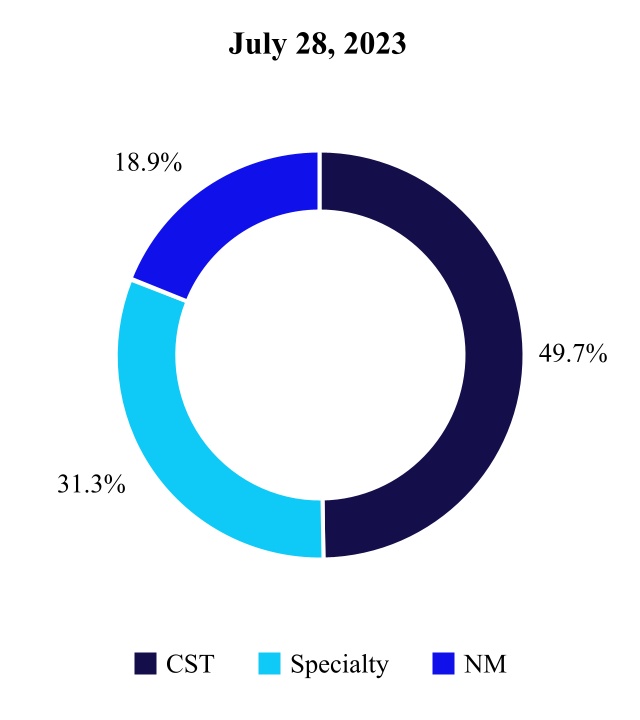
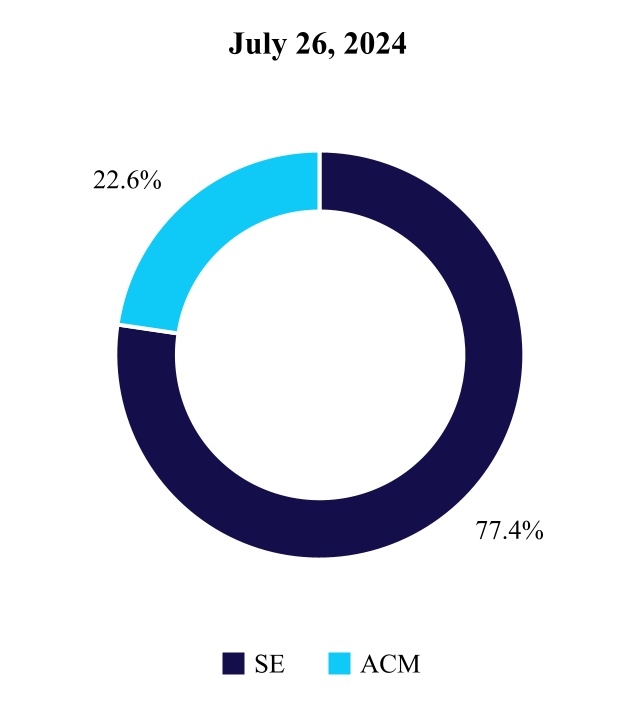
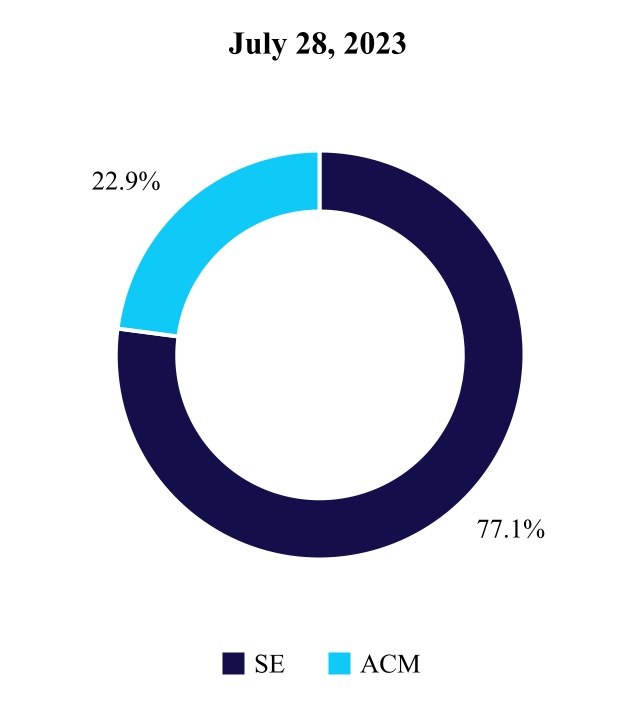
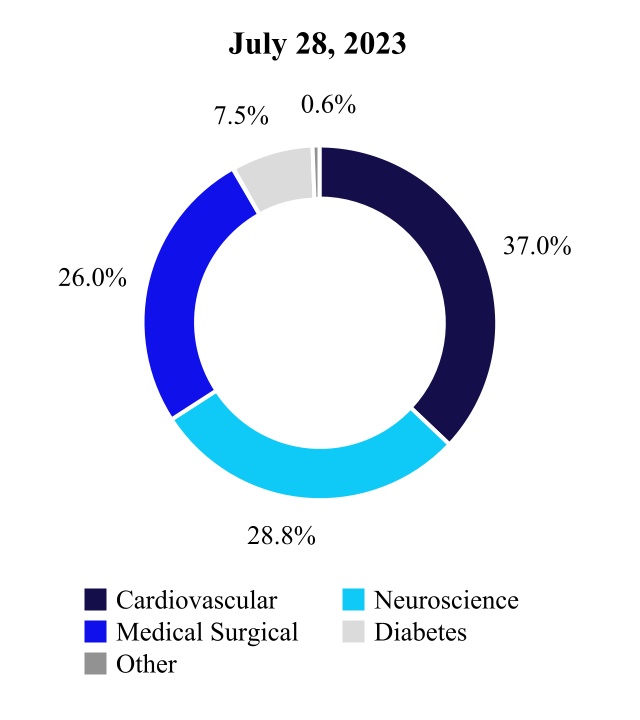
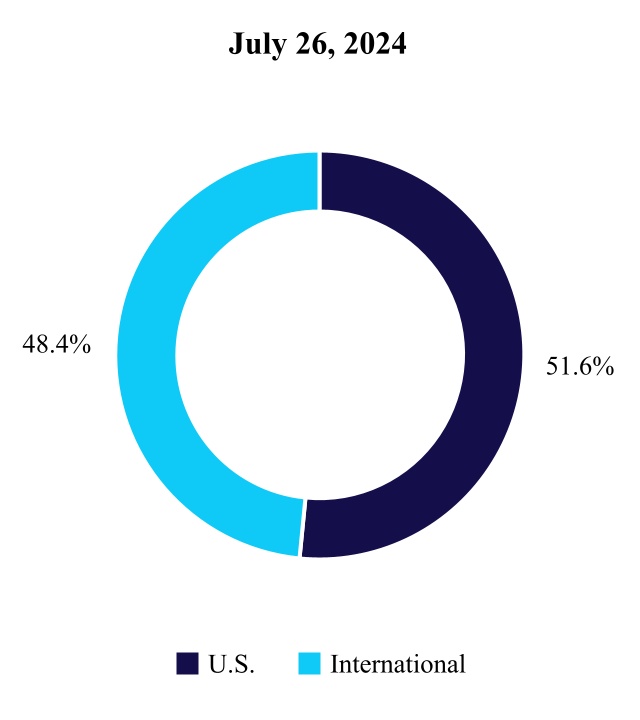
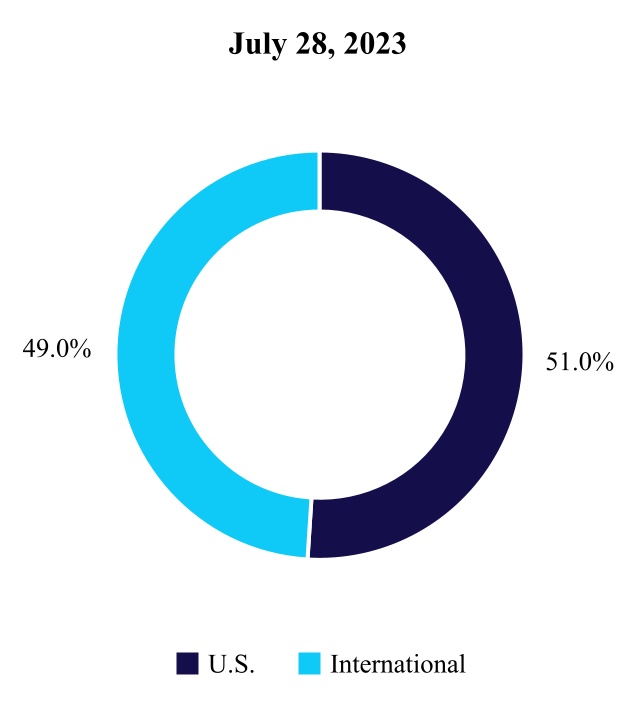
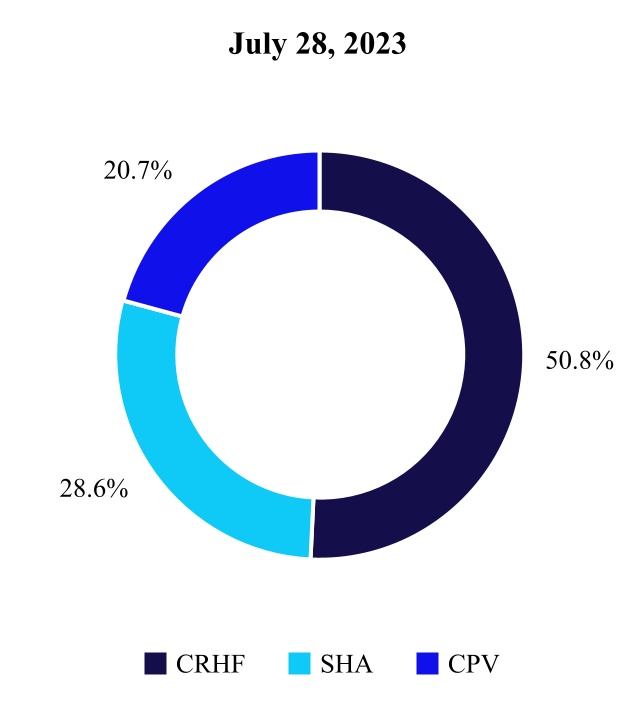
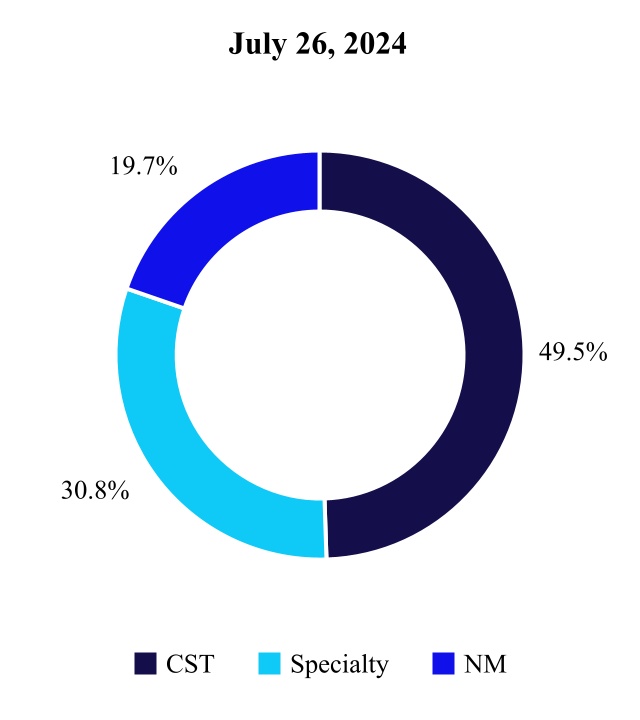
Notes to Consolidated Financial Statements (Unaudited) The table below illustrates net sales by segment and division and by market geography for the three months ended July 26, 2024 and July 28, 2023. The U.S. revenue includes United States and U.S. territories, and the international revenue includes all other non-U.S. countries. Three months ended (in millions) July 26, 2024 July 28, 2023 Cardiac Rhythm & Heart Failure $ 1,535 $ 1,446 Structural Heart & Aortic 856 814 Coronary & Peripheral Vascular 616 589 Cardiovascular 3,007 2,850 Cranial & Spinal Technologies 1,147 1,103 Specialty Therapies 713 695 Neuromodulation 457 420 Neuroscience 2,317 2,219 Surgical & Endoscopy 1,544 1,546 Acute Care & Monitoring 452 459 Medical Surgical 1,996 2,005 Diabetes 647 578 Total reportable segment net sales 7,967 7,652 Other operating segment (1) 38 50 Other adjustments (2) ( 90 ) — Total net sales $ 7,915 $ 7,702 U.S. International Three months ended Three months ended (in millions) July 26, 2024 July 28, 2023 July 26, 2024 July 28, 2023 Cardiovascular $ 1,403 $ 1,350 $ 1,604 $ 1,500 Neuroscience 1,565 1,497 752 721 Medical Surgical 881 867 1,115 1,137 Diabetes 215 188 432 390 Reportable segment net sales 4,064 3,903 3,903 3,749 Other operating segment (1) 18 22 19 28 Other adjustments (2) — — ( 90 ) — Total $ 4,082 $ 3,924 $ 3,832 $ 3,777 (1) Includes the historical operations and ongoing transition agreements from businesses the Company has exited or divested. (2) Incremental Italian payback accruals resulting from the two July 22, 2024 rulings by the Constitutional Court of Italy relating to certain prior years since 2015. The amount of revenue recognized is reduced by sales rebates and returns. Adjustments to rebates and returns reserves are recorded as increases or decreases to revenue. At July 26, 2024, $ 1.0 billion of rebates were classified as other accrued expenses , and $ 591 million of rebates were classified as a reduct
Notes to Consolidated Financial Statements
Notes to Consolidated Financial Statements (Unaudited) Deferred Revenue and Remaining Performance Obligations Deferred revenue at July 26, 2024 and April 26, 2024 was $ 461 million and $ 453 million, respectively. At July 26, 2024 and April 26, 2024, $ 362 million and $ 352 million was included in other accrued expenses, respectively, and $ 99 million and $ 101 million was included in other liabilities, respectively. During the three months ended July 26, 2024, the Company recognized $ 108 million of revenue that was included in deferred revenue as of April 26, 2024. During the three months ended July 28, 2023, the Company recognized $ 124 million of revenue that was included in deferred revenue as of April 28, 2023. Remaining performance obligations include goods and services that have not yet been delivered or provided under existing, noncancellable contracts with minimum purchase commitments. At July 26, 2024, the estimated revenue expected to be recognized in future periods related to unsatisfied performance obligations for executed contracts with an original duration of one year or more was approximately $ 0.4 billion. The Company expects to recognize revenue on the majority of these remaining performance obligations over the next two years . 4. Acquisitions and Dispositions Acquisition Activity During the three months ended July 26, 2024, the Company had no acquisitions that were accounted for as business combinations. During the fiscal year ended April 26, 2024, the Company had acquisitions that were accounted for as business combinations. For the three months ended July 26, 2024 and the fiscal year ended April 26, 2024, purchase price allocation adjustments were not significant. Fiscal year 2024 The acquisition date fair value of net assets acquired during the fiscal year ended April 26, 2024 was $ 335 million. Based on preliminary valuations, assets acquired were primarily comprised of $ 131 million of goodwill, $ 150 million of IPR&D, and $ 29 m
Notes to Consolidated Financial Statements
Notes to Consolidated Financial Statements (Unaudited) The recurring Level 3 fair value measurements of contingent consideration for which a liability is recorded include the following significant unobservable inputs: Fair Value at (in millions) July 26, 2024 Unobservable Input Range Weighted Average (1) Revenue and other performance-based payments $ 61 Discount rate 16.5 % - 28.2 % 21.8 % Projected fiscal year of payment 2025 - 2029 2027 Product development and other milestone-based payments $ 67 Discount rate 5.5 % 5.5 % Projected fiscal year of payment 2025 - 2027 2025 (1) Unobservable inputs were weighted by the relative fair value of the contingent consideration liability. For projected fiscal year of payment, the amount represents the median of the inputs and is not a weighted average. On April 1, 2023, the Company and DaVita Inc. ("DaVita") completed the transaction for the Company to sell half of its Renal Care Solutions (RCS) business. In connection with the sale, the Company may be entitled to receive additional consideration based on the achievement of certain revenue, regulatory, and profitability milestones, with potential payouts starting in fiscal year 2026 through 2029. The fair value of the contingent consideration receivable at July 26, 2024 and April 26, 2024 was $ 58 million, and was recorded in other assets in the consolidated balance sheet. The following table provides a reconciliation of the beginning and ending balances of the Level 3 measurement of contingent consideration receivable: Three months ended (in millions) July 26, 2024 July 28, 2023 Beginning balance $ 58 $ 195 Change in fair value — ( 43 ) Ending balance $ 58 $ 152 5 . Restructuring and Other Costs For the three months ended July 26, 2024 and July 28, 2023, the Company incurred $ 62 million and $ 91 million, respectively, of restructuring and associated costs primarily related to employee termination benefits and facility consolidations to support cost
Notes to Consolidated Financial Statements
Notes to Consolidated Financial Statements (Unaudited) The following table summarizes the activity for the three months ended July 26, 2024: (in millions) Employee Termination Benefits Associated and Other Costs Total April 26, 2024 $ 136 $ 11 $ 147 Charges 56 15 71 Cash payments ( 71 ) ( 17 ) ( 87 ) Settled non-cash — ( 3 ) ( 3 ) Accrual adjustments (1) ( 9 ) — ( 9 ) July 26, 2024 $ 113 $ 6 $ 119 (1) Accrual adjustments primarily relate to certain employees identified for termination, finding other positions within the Company. 10 Medtronic plc
Notes to Consolidated Financial Statements
Notes to Consolidated Financial Statements (Unaudited) 6 . Financial Instruments Debt Securities The Company holds investments in marketable debt securities that are classified and accounted for as available-for-sale and are remeasured on a recurring basis. The following tables summarize the Company's investments in available-for-sale debt securities by significant investment category and the related consolidated balance sheet classification at July 26, 2024 and April 26, 2024: July 26, 2024 Valuation Balance Sheet Classification (in millions) Cost Unrealized Gains Unrealized Losses Fair Value Investments Other Assets Level 1: U.S. government and agency securities $ 462 $ — $ ( 14 ) $ 448 $ 448 $ — Level 2: Corporate debt securities 3,597 10 ( 83 ) 3,524 3,524 — U.S. government and agency securities 852 — ( 33 ) 818 818 — Mortgage-backed securities 729 3 ( 37 ) 695 695 — Non-U.S. government and agency securities 5 — — 5 5 — Other asset-backed securities 1,006 5 ( 3 ) 1,007 1,007 — Total Level 2 6,189 18 ( 158 ) 6,050 6,050 — Level 3: Auction rate securities 36 — ( 3 ) 33 — 33 Total available-for-sale debt securities $ 6,687 $ 18 $ ( 174 ) $ 6,531 $ 6,498 $ 33 April 26, 2024 Valuation Balance Sheet Classification (in millions) Cost Unrealized Gains Unrealized Losses Fair Value Investments Other Assets Level 1: U.S. government and agency securities $ 494 $ — $ ( 22 ) $ 472 $ 472 $ — Level 2: Corporate debt securities 3,953 4 ( 125 ) 3,832 3,832 — U.S. government and agency securities 847 — ( 43 ) 804 804 — Mortgage-backed securities 692 1 ( 50 ) 643 643 — Non-U.S. government and agency securities 5 — — 5 5 — Other asset-backed securities 941 2 ( 9 ) 934 934 — Total Level 2 6,438 7 ( 227 ) 6,218 6,218 — Level 3: Auction rate securities 36 — ( 3 ) 33 — 33 Total available-for-sale debt securities $ 6,968 $ 7 $ ( 252 ) $ 6,723 $ 6,690 $ 33 The amortized cost of debt securities excludes accrued interest, which is reported in other c
Notes to Consolidated Financial Statements
Notes to Consolidated Financial Statements (Unaudited) The following tables present the gross unrealized losses and fair values of the Company's available-for-sale debt securities that have been in a continuous unrealized loss position deemed to be temporary, aggregated by investment category at July 26, 2024 and April 26, 2024: July 26, 2024 Less than 12 months More than 12 months (in millions) Fair Value Unrealized Losses Fair Value Unrealized Losses Corporate debt securities $ 658 $ ( 10 ) $ 1,780 $ ( 74 ) U.S. government and agency securities 144 ( 2 ) 700 ( 45 ) Mortgage-backed securities — — 510 ( 37 ) Other asset-backed securities — — 248 ( 3 ) Auction rate securities — — 33 ( 3 ) Total $ 803 $ ( 12 ) $ 3,272 $ ( 162 ) April 26, 2024 Less than 12 months More than 12 months (in millions) Fair Value Unrealized Losses Fair Value Unrealized Losses Corporate debt securities $ 661 $ ( 10 ) $ 2,448 $ ( 116 ) U.S. government and agency securities 177 ( 4 ) 730 ( 61 ) Mortgage-backed securities — — 582 ( 50 ) Other asset-backed securities — — 502 ( 9 ) Auction rate securities — — 33 ( 3 ) Total $ 838 $ ( 14 ) $ 4,296 $ ( 238 ) The Company reviews the fair value hierarchy classification on a quarterly basis. Changes in the ability to observe valuation inputs may result in a reclassification of levels for certain securities within the fair value hierarchy. There were no transfers into or out of Level 3 during the three months ended July 26, 2024 and July 28, 2023. When a determination is made to classify an asset or liability within Level 3, the determination is based upon the significance of the unobservable inputs to the overall fair value measurement. Activity related to the Company's available-for-sale debt securities portfolio is as follows: Three months ended (in millions) July 26, 2024 July 28, 2023 Proceeds from sales $ 2,157 $ 1,747 Gross realized gains 7 5 Gross realized losses ( 7 ) ( 12 ) The contractual maturities of availabl