Seer, Inc. Files 2023 Annual Report on Form 10-K
Ticker: SEER · Form: 10-K · Filed: Mar 4, 2024 · CIK: 1726445
| Field | Detail |
|---|---|
| Company | Seer, Inc. (SEER) |
| Form Type | 10-K |
| Filed Date | Mar 4, 2024 |
| Risk Level | medium |
| Pages | 14 |
| Reading Time | 17 min |
| Key Dollar Amounts | $0.00001, $27 billion, $28 billion |
| Sentiment | neutral |
Sentiment: neutral
Topics: 10-K, Annual Report, Seer Inc., Financials, Biotechnology
TL;DR
<b>Seer, Inc. has filed its 2023 annual report (10-K) detailing its financial performance and business operations.</b>
AI Summary
Seer, Inc. (SEER) filed a Annual Report (10-K) with the SEC on March 4, 2024. Seer, Inc. filed its 2023 Form 10-K on March 4, 2024. The filing covers the fiscal year ending December 31, 2023. The company's principal business address is 3800 Bridge Parkway, Suite 102, Redwood City, CA. Seer, Inc. was formerly known as Seer Biosciences, Inc. until December 26, 2017. The SIC code for Seer, Inc. is 3826, indicating Laboratory Analytical Instruments.
Why It Matters
For investors and stakeholders tracking Seer, Inc., this filing contains several important signals. This 10-K filing provides a comprehensive overview of Seer, Inc.'s financial health, operational activities, and strategic direction for the fiscal year 2023, which is crucial for investors to assess the company's performance and future prospects. Understanding the details within this filing, such as revenue, expenses, assets, and liabilities, is essential for stakeholders to make informed investment decisions and evaluate potential risks associated with Seer, Inc.
Risk Assessment
Risk Level: medium — Seer, Inc. shows moderate risk based on this filing. The filing is a standard 10-K, which is a comprehensive annual report. While it contains detailed financial information, it does not inherently signal immediate positive or negative performance trends without further analysis of the specific numbers and disclosures.
Analyst Insight
Investors should review the detailed financial statements and risk factors within the 10-K to assess Seer, Inc.'s financial health and future growth potential.
Key Numbers
- 2023-12-31 — Fiscal Year End (Conformed period of report)
- 2024-03-04 — Filing Date (Filed as of date)
- 3826 — SIC Code (Laboratory Analytical Instruments)
Key Players & Entities
- Seer, Inc. (company) — Filer name
- 0000950170-24-024967 (other) — Accession number
- 20231231 (date) — Conformed period of report
- 20240304 (date) — Filed as of date
- 3800 Bridge Parkway, Suite 102, Redwood City, CA 94065 (address) — Business address
- Seer Biosciences, Inc. (company) — Former company name
- 3826 (other) — Standard Industrial Classification
- David Horn (person) — Mentioned in context of executive compensation or board membership
FAQ
When did Seer, Inc. file this 10-K?
Seer, Inc. filed this Annual Report (10-K) with the SEC on March 4, 2024.
What is a 10-K filing?
A 10-K is a comprehensive annual financial report required by the SEC, covering audited financials, business operations, risk factors, and management discussion. This particular 10-K was filed by Seer, Inc. (SEER).
Where can I read the original 10-K filing from Seer, Inc.?
You can access the original filing directly on the SEC's EDGAR system. The filing is publicly available and includes all exhibits and attachments submitted by Seer, Inc..
What are the key takeaways from Seer, Inc.'s 10-K?
Seer, Inc. filed this 10-K on March 4, 2024. Key takeaways: Seer, Inc. filed its 2023 Form 10-K on March 4, 2024.. The filing covers the fiscal year ending December 31, 2023.. The company's principal business address is 3800 Bridge Parkway, Suite 102, Redwood City, CA..
Is Seer, Inc. a risky investment based on this filing?
Based on this 10-K, Seer, Inc. presents a moderate-risk profile. The filing is a standard 10-K, which is a comprehensive annual report. While it contains detailed financial information, it does not inherently signal immediate positive or negative performance trends without further analysis of the specific numbers and disclosures.
What should investors do after reading Seer, Inc.'s 10-K?
Investors should review the detailed financial statements and risk factors within the 10-K to assess Seer, Inc.'s financial health and future growth potential. The overall sentiment from this filing is neutral.
How does Seer, Inc. compare to its industry peers?
Seer, Inc. operates in the Laboratory Analytical Instruments industry, focusing on developing and commercializing technologies for biological sample analysis.
Are there regulatory concerns for Seer, Inc.?
As a publicly traded company, Seer, Inc. is subject to the reporting requirements of the Securities and Exchange Commission (SEC), including the annual filing of Form 10-K.
Industry Context
Seer, Inc. operates in the Laboratory Analytical Instruments industry, focusing on developing and commercializing technologies for biological sample analysis.
Regulatory Implications
As a publicly traded company, Seer, Inc. is subject to the reporting requirements of the Securities and Exchange Commission (SEC), including the annual filing of Form 10-K.
What Investors Should Do
- Analyze the detailed financial statements within the 10-K to understand revenue, expenses, and profitability.
- Review the 'Risk Factors' section to identify potential challenges and uncertainties facing Seer, Inc.
- Compare key financial metrics from this 10-K with previous filings to identify trends and assess performance changes.
Key Dates
- 2023-12-31: Fiscal Year End — Marks the end of the reporting period for the 10-K.
- 2024-03-04: Filing Date — Date Seer, Inc. submitted its 10-K to the SEC.
Year-Over-Year Comparison
This is the initial 10-K filing for the period ending December 31, 2023. Comparative data from prior periods will be available within the detailed financial statements.
Filing Stats: 4,307 words · 17 min read · ~14 pages · Grade level 15.6 · Accepted 2024-03-04 17:25:27
Key Financial Figures
- $0.00001 — 728,211 shares of Class A common stock, $0.00001 par value per share, and 4,044,969 of C
- $27 billion — l proteomics market to be approximately $27 billion in 2022. The Proteograph's unique capab
- $28 billion — imated by Technavio to be approximately $28 billion in 2022. Additionally, we believe that
Filing Documents
- ck0001726445-20231231.htm (10-K) — 2619KB
- ck0001726445-ex4_2.htm (EX-4.2) — 58KB
- ck0001726445-ex10_14.htm (EX-10.14) — 60KB
- ck0001726445-ex19_1.htm (EX-19.1) — 254KB
- ck0001726445-ex23_1.htm (EX-23.1) — 3KB
- ck0001726445-ex31_1.htm (EX-31.1) — 13KB
- ck0001726445-ex31_2.htm (EX-31.2) — 13KB
- ck0001726445-ex32_1.htm (EX-32.1) — 8KB
- ck0001726445-ex32_2.htm (EX-32.2) — 8KB
- ck0001726445-ex97_1.htm (EX-97.1) — 48KB
- img35236744_0.jpg (GRAPHIC) — 55KB
- img35236744_1.jpg (GRAPHIC) — 126KB
- img35236744_2.jpg (GRAPHIC) — 22KB
- img35236744_3.jpg (GRAPHIC) — 16KB
- img35236744_4.jpg (GRAPHIC) — 25KB
- img35236744_5.jpg (GRAPHIC) — 23KB
- img35236744_6.jpg (GRAPHIC) — 61KB
- img35236744_7.jpg (GRAPHIC) — 42KB
- img35236744_8.jpg (GRAPHIC) — 79KB
- img35236744_9.jpg (GRAPHIC) — 59KB
- img35236744_10.jpg (GRAPHIC) — 52KB
- img35236744_11.jpg (GRAPHIC) — 59KB
- img35236744_12.jpg (GRAPHIC) — 22KB
- img35236744_13.jpg (GRAPHIC) — 267KB
- img35236744_14.jpg (GRAPHIC) — 106KB
- img35236744_15.jpg (GRAPHIC) — 14KB
- img35236744_16.jpg (GRAPHIC) — 56KB
- 0000950170-24-024967.txt ( ) — 13306KB
- ck0001726445-20231231.xsd (EX-101.SCH) — 1337KB
- ck0001726445-20231231_htm.xml (XML) — 1836KB
Business
Business 1 Item 1A.
Risk Factors
Risk Factors 38 Item 1B. Unresolved Staff Comments 87 Item 1C. Cybersecurity 87 Item 2.
Properties
Properties 88 Item 3.
Legal Proceedings
Legal Proceedings 88 Item 4. Mine Safety Disclosures 88 Part II. Item 5. Market for Registrant's Common Equity, Related Stockholder Matters and Issuer Purchases of Equity Securities 89 Item 6. [Reserved] 89 Item 7.
Management's Discussion and Analysis of Financial Condition and Results of Operations
Management's Discussion and Analysis of Financial Condition and Results of Operations 90 Item 7A.
Quantitative and Qualitative Disclosures About Market Risk
Quantitative and Qualitative Disclosures About Market Risk 99 Item 8.
Financial Statements and Supplementary Data
Financial Statements and Supplementary Data 99 Item 9. Changes in and Disagreements With Accountants on Accounting and Financial Disclosure 129 Item 9A.
Controls and Procedures
Controls and Procedures 129 Item 9B. Other Information 130 Item 9C. Disclosure Regarding Foreign Jurisdictions that Prevent Inspections 130 Part III. Item 10. Directors, Executive Officers and Corporate Governance 131 Item 11.
Executive Compensation
Executive Compensation 131 Item 12.
Security Ownership of Certain Beneficial Owners and Management and Related Stockholder Matters
Security Ownership of Certain Beneficial Owners and Management and Related Stockholder Matters 131 Item 13. Certain Relationships and Related Transactions, and Director Independence 131 Item 14. Principal Accounting Fees and Services 131 Part IV. Item 15. Exhibits and Financial Statement Schedules 132 Item 16. Form 10–K Summary 134
Signatures
Signatures 135 SPECIAL NOTE REGARDING FORWARD-LOOKING STATEMENTS This Annual Report on Form 10-K ("Annual Report") contains forward-looking statements. All statements other than statements of historical facts contained in this Annual Report, including statements regarding our future results of operations and financial position, business strategy, commercial activities and costs, research and development costs, timing and likelihood of success, as well as plans and objectives of management for future operations, are forward-looking statements. These statements involve known and unknown risks, uncertainties and other important factors that are in some cases beyond our control and may cause our actual results, performance or achievements to be materially different from any future results, performance or achievements expressed or implied by the forward-looking statements. In some cases, you can identify forward-looking statements by terms such as "may," "will," "should," "would," "expect," "plan," "anticipate," "could," "intend," "target," "project," "believe," "estimate," "predict," "potential," or "continue" or the negative of these terms or other similar expressions. Forward-looking statements contained in this Annual Report include, but are not limited to, statements about: estimates of our addressable market, market growth, key performance indicators, capital requirements and our needs for additional financing; our expectations regarding our financial performance, including among others, revenue, cost of revenue, gross profit, operating expenses, loss from operations and net losses; our ability to successfully implement our commercialization strategy and attract customers, including our plans for international expansion; the implementation of our business model, strategic plans and expected pricing for the Proteograph Product Suite; our expectations regarding the rate and degree of market acceptance of the Proteograph Product Suite; the impact o
Busi ness
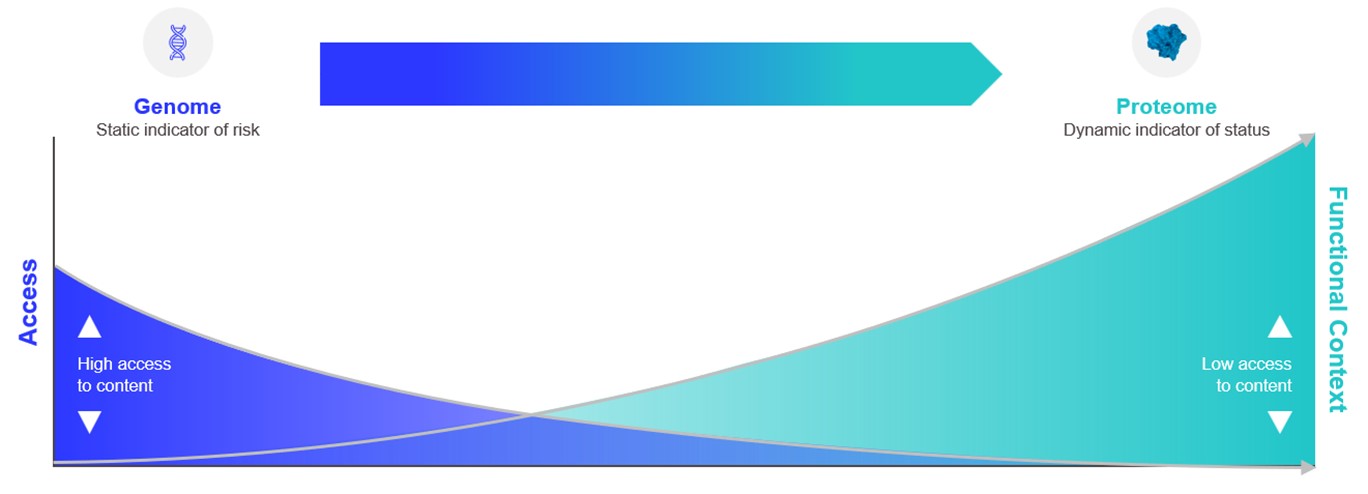
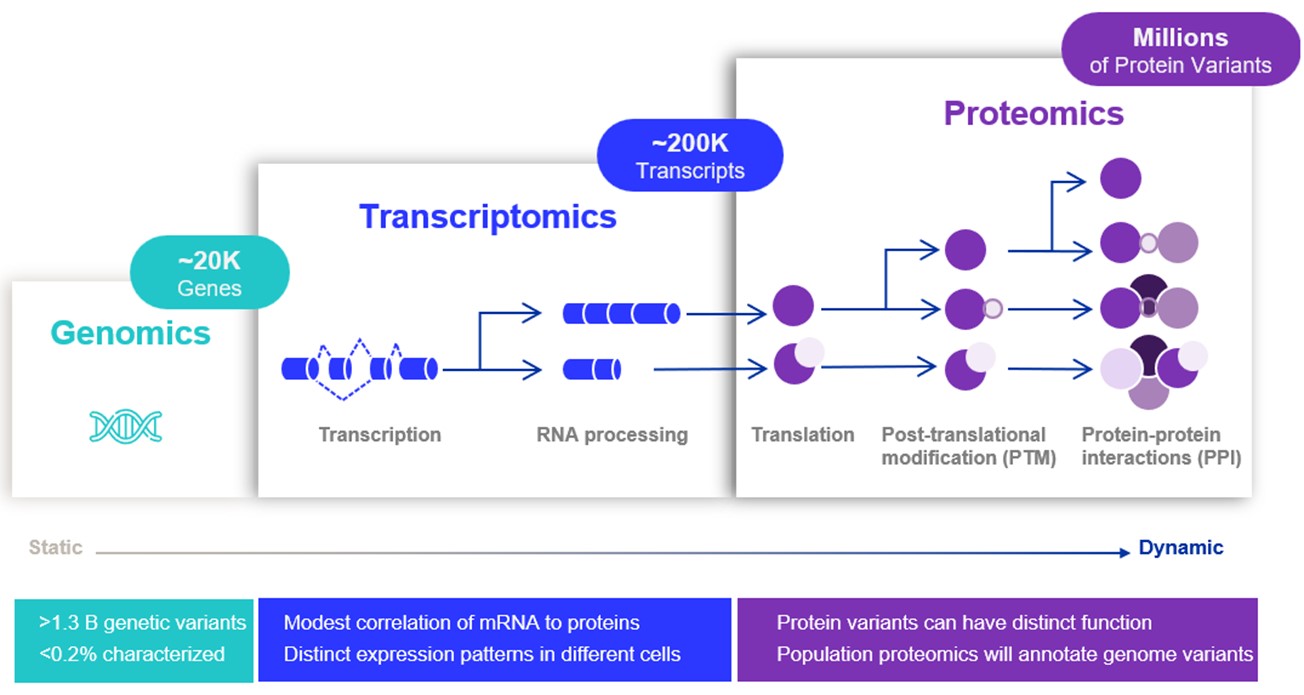
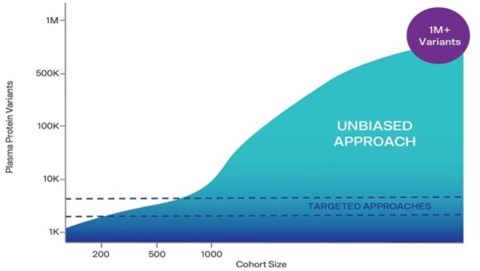
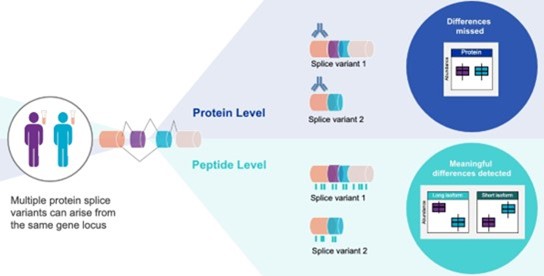
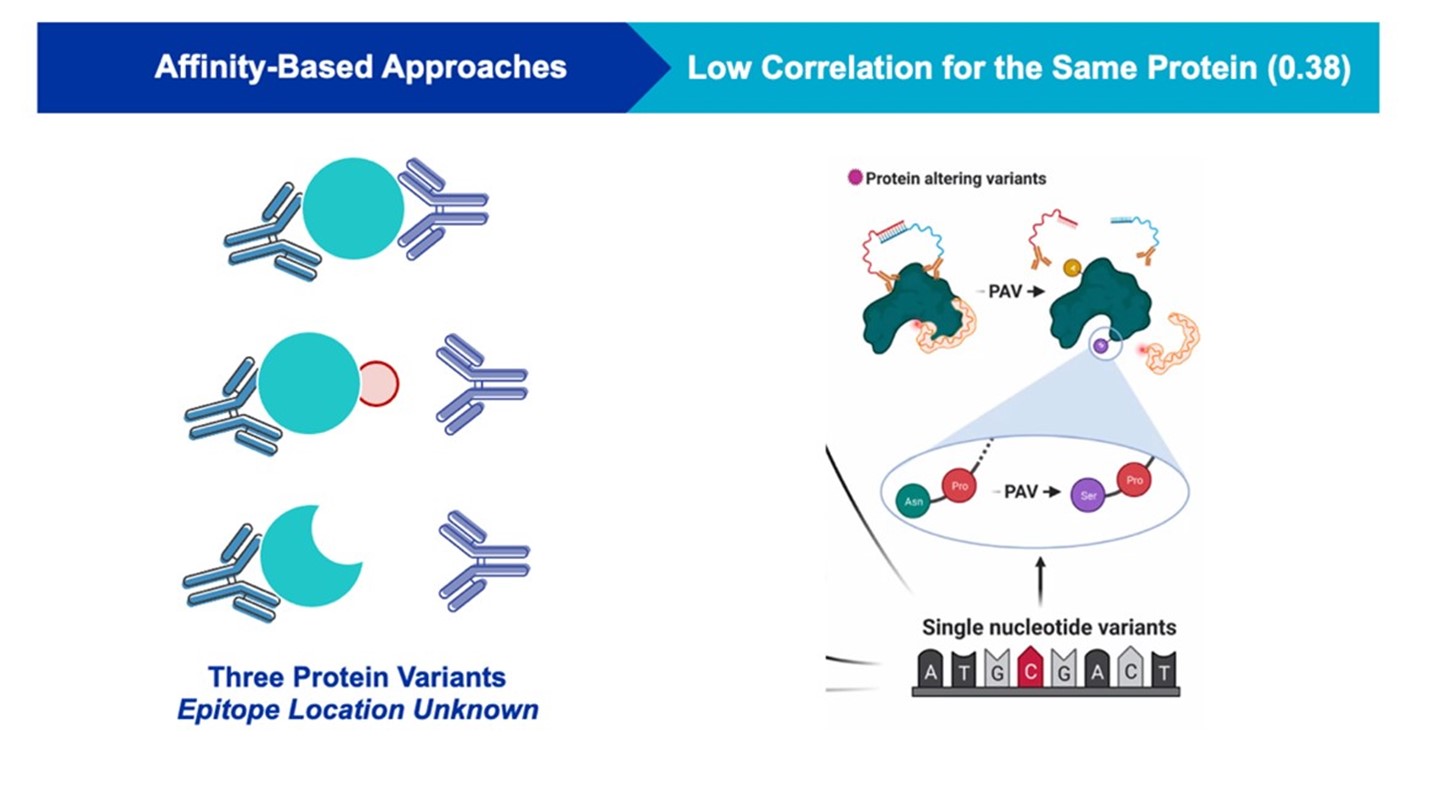
Item 1. Busi ness Overview Our mission is to imagine and pioneer new ways to decode the biology of the proteome to improve human health. Our product, the Proteograph TM Product Suite (Proteograph), leverages our proprietary engineered nanoparticle (NP) technology to provide unbiased, deep, rapid and large-scale access to the proteome. The Proteograph Product Suite is an integrated solution that includes consumables, an automation instrument and software. The human proteome is incredibly complex, with multiple protein variants derived from each gene. This complexity arises from multiple biological steps required to create the functional proteome, including transcription, translation, post-translational modifications (PTMs) and protein interactions. While many protein variants may be benign, others can severely disrupt protein function and contribute to disease. The complexity of the proteome at a population level is huge. For example, a study by the UK Biobank published in late 2021 in Nature identified over 900,000 potential protein loss-of-function variants in a cohort of approximately 455,000 individuals, with each individual having an average of more than 200 such variants (Backman et al. ). It is essential to catalog the complexity of the proteome and understand the functions of protein variants to decode the links between the proteome, the genome and disease. This deeper understanding can lead to novel insights into disease mechanisms, the discovery of new biomarkers and the identification of potential therapeutic targets. We believe that broader access to the proteome is essential, not only to understanding its complexity and accelerating biological insights, but also to expanding end-markets. These markets may include basic research and discovery, translational research, diagnostics and applied applications. To comprehend the complexity and dynamic nature of the proteome, researchers must perform population-scale, deep, unbiased interrogation of biolo