Constellation Brands Files Q1 2024 10-Q
Ticker: STZ · Form: 10-Q · Filed: Jul 3, 2024 · CIK: 16918
| Field | Detail |
|---|---|
| Company | Constellation Brands, Inc. (STZ) |
| Form Type | 10-Q |
| Filed Date | Jul 3, 2024 |
| Risk Level | low |
| Pages | 15 |
| Reading Time | 18 min |
| Key Dollar Amounts | $2.0 billion, $2.25 b, $100.0 million, $550.0 million, $0.01 |
| Sentiment | neutral |
Sentiment: neutral
Topics: 10-Q, financials, beverages
Related Tickers: STZ
TL;DR
**STZ Q1 10-Q FILED: Financials for the period ending May 31, 2024 are now public.**
AI Summary
Constellation Brands, Inc. filed its 10-Q for the period ending May 31, 2024. The company, headquartered in Rochester, NY, reported financial results for its fiscal first quarter. Key financial data and operational details for the period are detailed within this filing.
Why It Matters
This filing provides investors with the latest financial performance and operational updates for Constellation Brands, a major player in the beverage industry.
Risk Assessment
Risk Level: low — This is a routine quarterly financial filing providing standard disclosures.
Key Players & Entities
- CONSTELLATION BRANDS, INC. (company) — Filer
- 20240531 (date) — Period of Report
- 50 EAST BROAD STREET (address) — Business Address
- ROCHESTER (city) — Business Address City
- NY (state) — Business Address State
- 14614 (zip_code) — Business Address Zip
- 585-678-7100 (phone_number) — Business Phone
FAQ
What is the reporting period for this 10-Q filing?
The Conformed Period of Report is 20240531, indicating the filing covers the period ending May 31, 2024.
What is the company's primary industry classification?
The company's Standard Industrial Classification is BEVERAGES [2080].
Where is Constellation Brands, Inc. headquartered?
The company's business address is 50 EAST BROAD STREET, ROCHESTER, NY 14614.
When was the company incorporated or last changed its name?
The filing indicates previous name changes for 'CONSTELLATION BRANDS INC' on 20000920, 'CANANDAIGUA BRANDS INC' on 19970902, and 'CANANDAIGUA WINE CO INC' on 19920703.
What is the SEC file number for Constellation Brands?
The SEC File Number is 001-08495.
Filing Stats: 4,566 words · 18 min read · ~15 pages · Grade level 9.2 · Accepted 2024-07-03 13:15:42
Key Financial Figures
- $2.0 billion — ation authorization to repurchase up to $2.0 billion of our publicly traded common stock, ap
- $2.25 b — aggregate revolving credit facility of $2.25 billion, inclusive of October 2022 Credit
- $100.0 million — mber 2023 2023 Canopy Promissory Note C$100.0 million principal amount of 4.25% promissory no
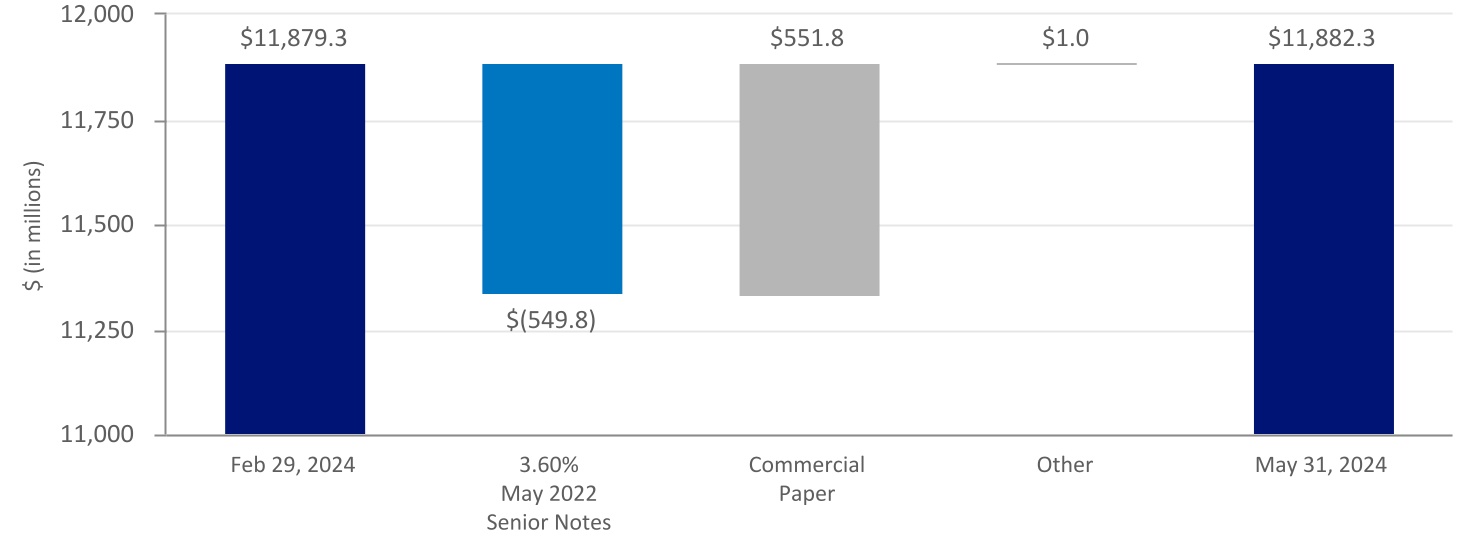
- $550.0 million — 29, 2024 3.60% May 2022 Senior Notes $550.0 million principal amount of 3.60% senior notes
- $0.01 — s 1 Convertible Common Stock, par value $0.01 per share Class A Stock our Class A Co
Filing Documents
- stz-20240531.htm (10-Q) — 1458KB
- stzex102_531202410q.htm (EX-10.2) — 83KB
- stzex311_531202410q.htm (EX-31.1) — 8KB
- stzex312_531202410q.htm (EX-31.2) — 8KB
- stzex321_531202410q.htm (EX-32.1) — 4KB
- stzex322_531202410q.htm (EX-32.2) — 4KB
- stz-20240531_g1.jpg (GRAPHIC) — 113KB
- stz-20240531_g2.jpg (GRAPHIC) — 2352KB
- stz-20240531_g3.jpg (GRAPHIC) — 41KB
- stz-20240531_g4.jpg (GRAPHIC) — 49KB
- stz-20240531_g5.jpg (GRAPHIC) — 53KB
- stz-20240531_g6.jpg (GRAPHIC) — 62KB
- 0000016918-24-000111.txt ( ) — 14904KB
- stz-20240531.xsd (EX-101.SCH) — 36KB
- stz-20240531_cal.xml (EX-101.CAL) — 93KB
- stz-20240531_def.xml (EX-101.DEF) — 311KB
- stz-20240531_lab.xml (EX-101.LAB) — 561KB
- stz-20240531_pre.xml (EX-101.PRE) — 455KB
- stz-20240531_htm.xml (XML) — 1287KB
– FINANCIAL INFORMATION
PART I – FINANCIAL INFORMATION
Financial Statements
Item 1. Financial Statements Consolidated Balance Sheets 1 Consolidated Statements of Comprehensive Income (Loss) 2 Consolidated Statements of Changes in Stockholders' Equity 3 Consolidated Statements of Cash Flows 4
Notes to Consolidated Financial Statements
Notes to Consolidated Financial Statements 1. Basis of Presentation 6 2. Inventories 6 3. Derivative Instruments 6 4. Fair Value of Financial Instruments 8 5. Goodwill 10 6. Intangible Assets 11 7. Other Assets 11 8. Borrowings 12 9. Income Taxes 14 10. Stockholders' Equity 14 11. Net Income (Loss) Per Common Share Attributable to CBI 15 12. Comprehensive Income (Loss) Attributable to CBI 16 13. Business Segment Information 17 14. Accounting Guidance Not Yet Adopted 20
Management's Discussion and Analysis of Financial Condition and Results of Operations 21
Item 2. Management's Discussion and Analysis of Financial Condition and Results of Operations 21
Quantitative and Qualitative Disclosures About Market Risk 38
Item 3. Quantitative and Qualitative Disclosures About Market Risk 38
Controls and Procedures 39
Item 4. Controls and Procedures 39
– OTHER INFORMATION
PART II – OTHER INFORMATION
Unregistered Sales of Equity Securities and Use of Proceeds 40
Item 2. Unregistered Sales of Equity Securities and Use of Proceeds 40
Other Information 40
Item 5. Other Information 40
Exhibits 40
Item 6. Exhibits 40 SIGNATURES 44 This Form 10-Q contains "forward-looking statements" within the meaning of Section 27A of the Securities Act and Section 21E of the Exchange Act. These forward-looking statements are subject to a number of risks and uncertainties, many of which are beyond our control, which could cause actual results to differ materially from those set forth in, or implied by, such forward-looking statements. For further information regarding such forward-looking statements, risks, and uncertainties, please see "Information Regarding Forward-Looking Statements" under MD&A. Table of Contents Defined Terms Unless the context otherwise requires, the terms "Company," "CBI," "we," "our," or "us" refer to Constellation Brands, Inc. and its subsidiaries. We use terms in this Form 10-Q and in our Notes that are specific to us or are abbreviations that may not be commonly known or used. Term Meaning $ U.S. dollars 2021 Authorization authorization to repurchase up to $2.0 billion of our publicly traded common stock, approved by our Board of Directors in January 2021 2022 Credit Agreement tenth amended and restated credit agreement, dated as of April 14, 2022, that provides for an aggregate revolving credit facility of $2.25 billion, inclusive of October 2022 Credit Agreement Amendment 2023 Authorization authorization to repurchase up to $2.0 billion of our publicly traded common stock, approved by our Board of Directors in November 2023 2023 Canopy Promissory Note C$100.0 million principal amount of 4.25% promissory note issued to us by Canopy in April 2023, exchanged, in part, for Exchangeable Shares in April 2024 2024 Annual Report our Annual Report on Form 10-K for the fiscal year ended February 29, 2024 3.60% May 2022 Senior Notes $550.0 million principal amount of 3.60% senior notes issued in May 2022, now repaid in full 3-tier distribution channel where products are sold to a distributor (wholesaler) who then sells to a retailer;
Financial Statements our consolidated financial statements and notes thereto included herein
Financial Statements our consolidated financial statements and notes thereto included herein First Quarter 2024 the Company's three months ended May 31, 2023 First Quarter 2025 the Company's three months ended May 31, 2024 Fiscal 2024 the Company's fiscal year ended February 29, 2024 Fiscal 2025 the Company's fiscal year ending February 28, 2025 Fiscal 2026 the Company's fiscal year ending February 28, 2026 Fiscal 2027 the Company's fiscal year ending February 28, 2027 Fiscal 2028 the Company's fiscal year ending February 29, 2028 Fiscal 2029 the Company's fiscal year ending February 28, 2029 Fiscal 2030 the Company's fiscal year ending February 28, 2030 Form 10-Q this Quarterly Report on Form 10-Q for the quarterly period ended May 31, 2024, unless otherwise specified Four Corners Divestiture sale of the Four Corners craft beer business Funky Buddha Divestiture sale of the Funky Buddha craft beer business GHG greenhouse gas IRA Inflation Reduction Act of 2022 IT information technology MD&A Management's Discussion and Analysis of Financial Condition and Results of Operations under Part I – Item 2. of this Form 10-Q Mexicali Brewery canceled brewery construction project located in Mexicali, Baja California, Mexico, closed on the sale of the remaining assets classified as held for sale in July 2024 Mexico Beer Projects expansion, optimization, and/or construction activities at the Obregn Brewery, Nava Brewery, and Veracruz Brewery M&T Manufacturers and Traders Trust Company NA not applicable Nava Nava, Coahuila, Mexico Nava Brewery brewery located in Nava Net sales gross sales less promotions, returns and allowances, and excise taxes NM not meaningful Note(s) notes to the consolidated financial statements Obregn Obregn, Sonora, Mexico Obregn Brewery brewery located in Obregn OCI other comprehensive income (loss) October 2022 Credit Agreement Amendment amendment dated as of October 18, 2022, to the 2022 Credit Agreement, effe
FINANCIAL STATEMENTS Table of Contents
FINANCIAL STATEMENTS Table of Contents
– FINANCIAL INFORMATION
PART I – FINANCIAL INFORMATION
Financial Statements
Item 1. Financial Statements. CONSTELLATION BRANDS, INC. AND SUBSIDIARIES CONSOLIDATED BALANCE SHEETS (in millions, except share and per share data) (unaudited) May 31, 2024 February 29, 2024 ASSETS Current assets: Cash and cash equivalents $ 73.8 $ 152.4 Accounts receivable 893.9 832.8 Inventories 2,127.0 2,078.3 Prepaid expenses and other 733.7 666.0 Total current assets 3,828.4 3,729.5 Property, plant, and equipment 8,298.0 8,055.2 Goodwill 7,985.4 7,980.3 Intangible assets 2,731.5 2,731.7 Deferred income taxes 2,020.3 2,055.0 Other assets 1,196.5 1,140.0 Total assets $ 26,060.1 $ 25,691.7 LIABILITIES AND STOCKHOLDERS' EQUITY Current liabilities: Short-term borrowings $ 793.2 $ 241.4 Current maturities of long-term debt 406.2 956.8 Accounts payable 1,139.3 1,107.1 Other accrued expenses and liabilities 783.5 836.4 Total current liabilities 3,122.2 3,141.7 Long-term debt, less current maturities 10,682.9 10,681.1 Deferred income taxes and other liabilities 1,683.1 1,804.3 Total liabilities 15,488.2 15,627.1 Commitments and contingencies CBI stockholders' equity: Class A Stock, $ 0.01 par value – Authorized, 322,000,000 shares; Issued, 212,698,298 shares and 212,698,298 shares, respectively 2.1 2.1 Additional paid-in capital 2,070.3 2,047.3 Retained earnings 14,109.5 13,417.2 Accumulated other comprehensive income (loss) 367.8 376.8 Class A Stock in treasury, at cost, 30,341,484 shares and 29,809,881 shares, respectively ( 6,297.9 ) ( 6,100.3 ) Total CBI stockholders' equity 10,251.8 9,743.1 Noncontrolling interests 320.1 321.5 Total stockholders' equity 10,571.9 10,064.6 Total liabilities and stockholders' equity $ 26,060.1 $ 25,691.7 The accompanying notes are an integral part of these statements. Constellation Brands, Inc. Q1 FY 2025 Form 10-Q #WORTHREACHINGFOR I 1
FINANCIAL STATEMENTS Table of Contents
FINANCIAL STATEMENTS Table of Contents CONSTELLATION BRANDS, INC. AND SUBSIDIARIES CONSOLIDATED STATEMENTS OF COMPREHENSIVE INCOME (LOSS) (in millions, except per share data) (unaudited) For the Three Months Ended May 31, 2024 2023 Sales $ 2,860.7 $ 2,699.5 Excise taxes ( 198.9 ) ( 184.6 ) Net sales 2,661.8 2,514.9 Cost of product sold ( 1,258.0 ) ( 1,257.1 ) Gross profit 1,403.8 1,257.8 Selling, general, and administrative expenses ( 462.2 ) ( 493.1 ) Operating income (loss) 941.6 764.7 Income (loss) from unconsolidated investments 82.0 ( 415.4 ) Interest expense, net ( 102.8 ) ( 118.9 ) Income (loss) before income taxes 920.8 230.4 (Provision for) benefit from income taxes ( 28.0 ) ( 91.2 ) Net income (loss) 892.8 139.2 Net (income) loss attributable to noncontrolling interests ( 15.8 ) ( 3.3 ) Net income (loss) attributable to CBI $ 877.0 $ 135.9 Comprehensive income (loss) $ 884.1 $ 364.5 Comprehensive (income) loss attributable to noncontrolling interests ( 16.1 ) ( 14.2 ) Comprehensive income (loss) attributable to CBI $ 868.0 $ 350.3 Class A Stock: Net income (loss) per common share attributable to CBI – basic $ 4.80 $ 0.74 Net income (loss) per common share attributable to CBI – diluted $ 4.78 $ 0.74 Weighted average common shares outstanding – basic 182.766 183.270 Weighted average common shares outstanding – diluted 183.461 183.863 Cash dividends declared per common share $ 1.01 $ 0.89 The accompanying notes are an integral part of these statements. Constellation Brands, Inc. Q1 FY 2025 Form 10-Q #WORTHREACHINGFOR I 2
FINANCIAL STATEMENTS Table of Contents
FINANCIAL STATEMENTS Table of Contents CONSTELLATION BRANDS, INC. AND SUBSIDIARIES CONSOLIDATED STATEMENTS OF CHANGES IN STOCKHOLDERS' EQUITY (in millions) (unaudited) Class A Stock Additional Paid-in Capital Retained Earnings Accumulated Other Comprehensive Income (Loss) Treasury Stock Non-controlling Interests Total Balance at February 29, 2024 $ 2.1 $ 2,047.3 $ 13,417.2 $ 376.8 $ ( 6,100.3 ) $ 321.5 $ 10,064.6 Comprehensive income (loss): Net income (loss) — — 877.0 — — 15.8 892.8 Other comprehensive income (loss), net of income tax effect — — — ( 9.0 ) — 0.3 ( 8.7 ) Comprehensive income (loss) 884.1 Repurchase of shares — — — — ( 200.0 ) — ( 200.0 ) Dividends declared — — ( 184.7 ) — — — ( 184.7 ) Non-controlling interest distributions — — — — — ( 17.5 ) ( 17.5 ) Shares issued under equity compensation plans — 5.7 — — 2.4 — 8.1 Stock-based compensation — 17.3 — — — — 17.3 Balance at May 31, 2024 $ 2.1 $ 2,070.3 $ 14,109.5 $ 367.8 $ ( 6,297.9 ) $ 320.1 $ 10,571.9 Balance at February 28, 2023 $ 2.1 $ 1,903.0 $ 12,343.9 $ 28.5 $ ( 5,863.9 ) $ 320.3 $ 8,733.9 Comprehensive income (loss): Net income (loss) — — 135.9 — — 3.3 139.2 Other comprehensive income (loss), net of income tax effect — — — 214.4 — 10.9 225.3 Comprehensive income (loss) 364.5 Repurchase of shares — — — — ( 35.0 ) — ( 35.0 ) Dividends declared — — ( 163.1 ) — — — ( 163.1 ) Noncontrolling interest distributions — — — — — ( 11.3 ) ( 11.3 ) Shares issued under equity compensation plans — 0.6 — — 4.1 — 4.7 Stock-based compensation — 14.5 — — — — 14.5 Balance at May 31, 2023 $ 2.1 $ 1,918.1 $ 12,316.7 $ 242.9 $ ( 5,894.8 ) $ 323.2 $ 8,908.2 The accompanying notes are an integral part of these statements. Constellation Brands, Inc. Q1 FY 2025 Form 10-Q #WORTHREACHINGFOR I 3
FINANCIAL STATEMENTS Table of Contents
FINANCIAL STATEMENTS Table of Contents CONSTELLATION BRANDS, INC. AND SUBSIDIARIES CONSOLIDATED STATEMENTS OF CASH FLOWS (in millions) (unaudited) For the Three Months Ended May 31, 2024 2023 CASH FLOWS FROM OPERATING ACTIVITIES Net income (loss) $ 892.8 $ 139.2 Adjustments to reconcile net income (loss) to net cash provided by (used in) operating activities: Unrealized net (gain) loss on securities measured at fair value — 71.8 Deferred tax provision (benefit) 25.0 ( 0.3 ) Depreciation 111.6 105.3 Stock-based compensation 17.3 14.5 Equity in (earnings) losses of equity method investees and related activities, net of distributed earnings 1.3 220.6 Noncash lease expense 29.1 22.0 Impairment of equity method investments — 123.5 Net gain on conversion and exchange to Exchangeable Shares ( 83.3 ) — Change in operating assets and liabilities, net of effects from purchase and sale of business: Accounts receivable ( 63.4 ) ( 31.5 ) Inventories ( 47.3 ) ( 57.6 ) Prepaid expenses and other current assets ( 61.4 ) ( 17.9 ) Accounts payable 62.7 34.2 Deferred revenue 15.6 24.3 Other accrued expenses and liabilities ( 97.7 ) ( 73.2 ) Other ( 111.8 ) 90.5 Total adjustments ( 202.3 ) 526.2 Net cash provided by (used in) operating activities 690.5 665.4 CASH FLOWS FROM INVESTING ACTIVITIES Purchase of property, plant, and equipment ( 375.3 ) ( 277.0 ) Investments in equity method investees and securities ( 13.0 ) ( 21.6 ) Proceeds from sale of assets 12.9 — Proceeds from sale of business — 6.7 Other investing activities ( 2.0 ) — Net cash provided by (used in) investing activities ( 377.4 ) ( 291.9 ) Constellation Brands, Inc. Q1 FY 2025 Form 10-Q #WORTHREACHINGFOR I 4
FINANCIAL STATEMENTS Table of Contents
FINANCIAL STATEMENTS Table of Contents CONSTELLATION BRANDS, INC. AND SUBSIDIARIES CONSOLIDATED STATEMENTS OF CASH FLOWS (in millions) (unaudited) For the Three Months Ended May 31, 2024 2023 CASH FLOWS FROM FINANCING ACTIVITIES Proceeds from issuance of long-term debt — 744.8 Principal payments of long-term debt ( 552.2 ) ( 502.5 ) Net proceeds from (repayments of) short-term borrowings 551.8 ( 346.3 ) Dividends paid ( 185.3 ) ( 164.1 ) Purchases of treasury stock ( 200.0 ) ( 35.0 ) Proceeds from shares issued under equity compensation plans 24.7 15.9 Payments of minimum tax withholdings on stock-based payment awards ( 13.8 ) ( 11.2 ) Payments of debt issuance, debt extinguishment, and other financing costs — ( 5.0 ) Distributions to noncontrolling interests ( 17.5 ) ( 11.3 ) Payment of contingent consideration ( 0.7 ) — Net cash provided by (used in) financing activities ( 393.0 ) ( 314.7 ) Effect of exchange rate changes on cash and cash equivalents 1.3 0.2 Net increase (decrease) in cash and cash equivalents ( 78.6 ) 59.0 Cash and cash equivalents, beginning of period 152.4 133.5 Cash and cash equivalents, end of period $ 73.8 $ 192.5 Supplemental disclosures of noncash investing and financing activities Additions to property, plant, and equipment $ 195.2 $ 142.2 The accompanying notes are an integral part of these statements. Constellation Brands, Inc. Q1 FY 2025 Form 10-Q #WORTHREACHINGFOR I 5
FINANCIAL STATEMENTS NOTES TO CONSOLIDATED FINANCIAL STATEMENTS Table of Contents
FINANCIAL STATEMENTS NOTES TO CONSOLIDATED FINANCIAL STATEMENTS Table of Contents CONSTELLATION BRANDS, INC. AND SUBSIDIARIES MAY 31, 2024 (unaudited) 1. BASIS OF PRESENTATION We have prepared the Financial Statements, without audit, pursuant to the rules and regulations of the SEC applicable to quarterly reporting on Form 10-Q and reflect, in our opinion, all adjustments necessary to present fairly our financial information. All such adjustments are of a normal recurring nature. Certain information and footnote disclosures normally included in financial statements, prepared in accordance with generally accepted accounting principles, have been condensed or omitted as permitted by such rules and regulations. These Financial Statements should be read in conjunction with the consolidated financial statements and related notes included in the 2024 Annual Report. Results of operations for interim periods are not necessarily indicative of annual results. Reclassification We reclassified equity method investments to other assets on our consolidated balance sheet as of February 29, 2024, to conform with current year presentation. 2. INVENTORIES Inventories are stated at the lower of cost (primarily computed in accordance with the first-in, first-out method) or net realizable value. Elements of cost include materials, labor, and overhead and consist of the following: May 31, 2024 February 29, 2024 (in millions) Raw materials and supplies $ 244.1 $ 254.1 In-process inventories 1,109.5 1,096.0 Finished case goods 773.4 728.2 $ 2,127.0 $ 2,078.3 3. DERIVATIVE INSTRUMENTS Overview Our risk management and derivative accounting policies are presented in Notes 1 and 6 of our consolidated financial statements included in our 2024 Annual Report and have not changed significantly for the three months ended May 31, 2024. The aggregate notional value of outstanding derivative instruments is as follows: May 31, 2024 February 29, 2024 (in millions) Deriva
FINANCIAL STATEMENTS NOTES TO CONSOLIDATED FINANCIAL STATEMENTS Table of Contents
FINANCIAL STATEMENTS NOTES TO CONSOLIDATED FINANCIAL STATEMENTS Table of Contents financial institutions that have earned investment-grade credit ratings and with whom we have standard International Swaps and Derivatives Association agreements which allow for net settlement of the derivative contracts. We have also established counterparty credit guidelines that are regularly monitored. Because of these safeguards, we believe the risk of loss from counterparty default to be immaterial. In addition, our derivative instruments are not subject to credit rating contingencies or collateral requirements. As of May 31, 2024, the estimated fair value of derivative instruments in a net liability position due to counterparties was $ 2.2 million. If we were required to settle the net liability position under these derivative instruments on May 31, 2024, we would have had sufficient available liquidity on hand to satisfy this obligation. Results of period derivative activity The estimated fair value and location of our derivative instruments on our balance sheets are as follows (see Note 4): Assets Liabilities May 31, 2024 February 29, 2024 May 31, 2024 February 29, 2024 (in millions) Derivative instruments designated as hedging instruments Foreign currency contracts: Prepaid expenses and other $ 148.0 $ 154.1 Other accrued expenses and liabilities $ 2.5 $ 3.5 Other assets $ 141.0 $ 153.5 Deferred income taxes and other liabilities $ 0.5 $ 0.2 Derivative instruments not designated as hedging instruments Foreign currency contracts: Prepaid expenses and other $ 2.7 $ 3.6 Other accrued expenses and liabilities $ 3.8 $ 1.7 Commodity derivative contracts: Prepaid expenses and other $ 11.2 $ 4.8 Other accrued expenses and liabilities $ 19.1 $ 27.9 Other assets $ 5.7 $ 1.4 Deferred income taxes and other liabilities $ 4.5 $ 8.1 The principal effect of our derivative instruments designated in cash flow hedging relationships on our results of operations, as well
FINANCIAL STATEMENTS NOTES TO CONSOLIDATED FINANCIAL STATEMENTS Table of Contents
FINANCIAL STATEMENTS NOTES TO CONSOLIDATED FINANCIAL STATEMENTS Table of Contents We expect $ 128.3 million of net gains, net of income tax effect, to be reclassified from AOCI to our results of operations within the next 12 months. The effect of our undesignated derivative instruments on our results of operations is as follows: Derivative Instruments Not Designated as Hedging Instruments Location of Net Gain (Loss) Recognized in Income (Loss) Net Gain (Loss) Recognized in Income (Loss) (in millions) For the Three Months Ended May 31, 2024 Commodity derivative contracts Cost of product sold $ 14.6 Foreign currency contracts Selling, general, and administrative expenses 4.0 $ 18.6 For the Three Months Ended May 31, 2023 Commodity derivative contracts Cost of product sold $ ( 34.7 ) Foreign currency contracts Selling, general, and administrative expenses 12.7 $ ( 22.0 ) 4. FAIR VALUE OF FINANCIAL INSTRUMENTS Authoritative guidance establishes a framework for measuring fair value, including a hierarchy for inputs used in measuring fair value that maximizes the use of observable inputs and minimizes the use of unobservable inputs by requiring that the most observable inputs be used when available. The hierarchy includes three levels: Level 1 inputs are quoted prices in active markets for identical assets or liabilities; Level 2 inputs include data points that are observable such as quoted prices for similar assets or liabilities in active markets, quoted prices for identical assets or similar assets or liabilities in markets that are not active, and inputs (other than quoted prices) such as volatility, interest rates, and yield curves that are observable for the asset or liability, either directly or indirectly; and Level 3 inputs are unobservable data points for the asset or liability, and include situations where there is little, if any, market activity for the asset or liability. Fair value methodology The following methods and assumption
FINANCIAL STATEMENTS NOTES TO CONSOLIDATED FINANCIAL STATEMENTS Table of Contents
FINANCIAL STATEMENTS NOTES TO CONSOLIDATED FINANCIAL STATEMENTS Table of Contents term debt, including the current portion, was $ 11,637.9 million, compared with an estimated fair value of $ 10,775.8 million. The carrying amounts of certain of our financial instruments, including cash and cash equivalents, accounts receivable, and accounts payable, approximate fair value as of May 31, 2024, and February 29, 2024, due to the relatively short maturity of these instruments. Recurring basis measurements The following table presents our financial assets and liabilities measured at estimated fair value on a recurring basis: Fair Value Measurements Using Quoted Prices in Active Markets (Level 1) Significant Other Observable Inputs (Level 2) Significant Unobservable Inputs (Level 3) Total (in millions) May 31, 2024 Assets: Foreign currency contracts $ — $ 291.7 $ — $ 291.7 Commodity derivative contracts $ — $ 16.9