PNC Financial Services Group Files Q2 2024 10-Q
Ticker: PNC · Form: 10-Q · Filed: 2024-08-02T00:00:00.000Z
Sentiment: neutral
Topics: 10-Q, financials, reporting, SEC
Related Tickers: JPM, BAC, WFC, SCHW
TL;DR
**PNC filed its Q2 10-Q, all clear on reporting requirements.**
AI Summary
PNC Financial Services Group, Inc. filed its quarterly report for the period ended June 30, 2024. The company, incorporated in Pennsylvania with IRS Employer Identification No. 25-1435979, is registered with the SEC under file number 001-09718. Its common stock trades on the New York Stock Exchange under the symbol PNC. The filing confirms that PNC has met all its reporting requirements for the preceding 12 months and the past 90 days, including submitting interactive data files.
Why It Matters
This filing provides an update on PNC's financial health and regulatory compliance for the second quarter of 2024, which is crucial for investors and stakeholders to assess the company's performance and stability.
Risk Assessment
Risk Level: low — This filing is a routine quarterly report and does not indicate any immediate or significant risks.
Key Numbers
- 001-09718 — Commission File Number (Identifies the company's registration with the SEC.)
- 25-1435979 — IRS Employer Identification No. (Unique tax identification number for the company.)
Key Players & Entities
- PNC Financial Services Group, Inc. (company) — Registrant
- June 30, 2024 (date) — Quarterly period end date
- 001-09718 (other) — Commission file number
- Pennsylvania (location) — State of incorporation
- 25-1435979 (other) — I.R.S. Employer Identification No.
- The Tower at PNC Plaza (location) — Principal executive office address
- 300 Fifth Avenue (location) — Principal executive office address
- Pittsburgh (location) — Principal executive office address
- 15222-2401 (other) — Principal executive office zip code
- PNC (company) — Trading Symbol
FAQ
What is the reporting period for this 10-Q filing?
The reporting period for this 10-Q filing is the quarterly period ended June 30, 2024.
What is the trading symbol for PNC Financial Services Group, Inc. common stock?
The trading symbol for PNC Financial Services Group, Inc. common stock is PNC.
On which exchange is PNC's common stock registered?
PNC's common stock is registered on the New York Stock Exchange.
Has PNC filed all required reports for the preceding 12 months?
Yes, the filing indicates that PNC has filed all reports required to be filed by Section 13 or 15(d) of the Securities Exchange Act of 1934 during the preceding 12 months.
Has PNC submitted all required interactive data files for the past 12 months?
Yes, the filing indicates that PNC has submitted electronically every Interactive Data File required to be submitted pursuant to Rule 405 of Regulation S-T during the preceding 12 months.
Filing Stats: 4,590 words · 18 min read · ~15 pages · Grade level 12.7 · Accepted 2024-08-02 10:12:25
Key Financial Figures
- $5.00 — ch Registered Common Stock, par value $5.00 PNC New York Stock Exchange Indicate
- $5 — hares of the registrant's common stock ($5 par value) outstanding. T HE PNC F IN
- $16.0 billion — red portfolio represented approximately $16.0 billion in total commitments, including approxi
- $9.0 billion — al commitments, including approximately $9.0 billion of funded loans, at the time of acquisi
- $325 m — 2024 personnel expense by approximately $325 million, on a pre-tax basis. PNC incurred
- $150 million — pre-tax basis. PNC incurred expenses of $150 million in the fourth quarter of 2023 in connec
- $515 million — sult, PNC incurred a pre-tax expense of $515 million during the fourth quarter of 2023. In t
- $130 million — curred an additional pre-tax expense of $130 million related to the increase in the FDIC's e
- $1.5 b — me Statement Highlights Net income of $1.5 billion, or $3.39 per diluted common shar
- $3.39 — lights Net income of $1.5 billion, or $3.39 per diluted common share, for the secon
- $133 m — or the second quarter of 2024 increased $133 million, or 10%, compared to $1.3 billion
- $1.3 b — eased $133 million, or 10%, compared to $1.3 billion, or $3.10 per diluted common shar
- $3.10 — n, or 10%, compared to $1.3 billion, or $3.10 per diluted common share, for the first
- $266 m — arch 31, 2024: Total revenue increased $266 million, or 5%, to $5.4 billion. Net int
- $5.4 billion — venue increased $266 million, or 5%, to $5.4 billion. Net interest income of $3.3 billion i
Filing Documents
- pnc-20240630.htm (10-Q) — 7507KB
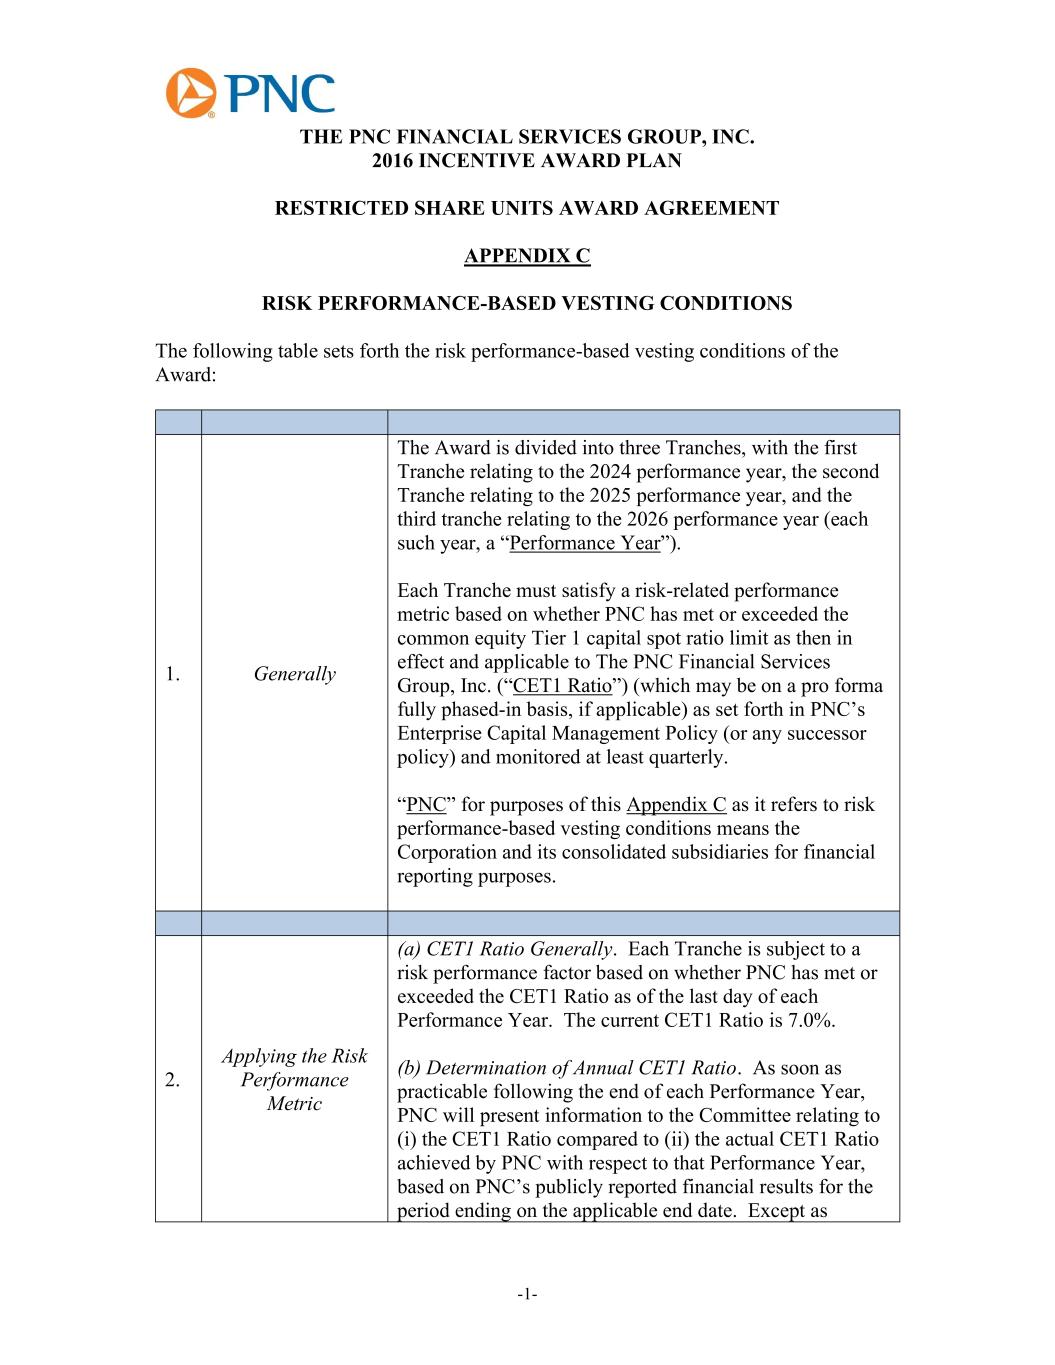
- a24psufinal.htm (EX-10.30) — 72KB
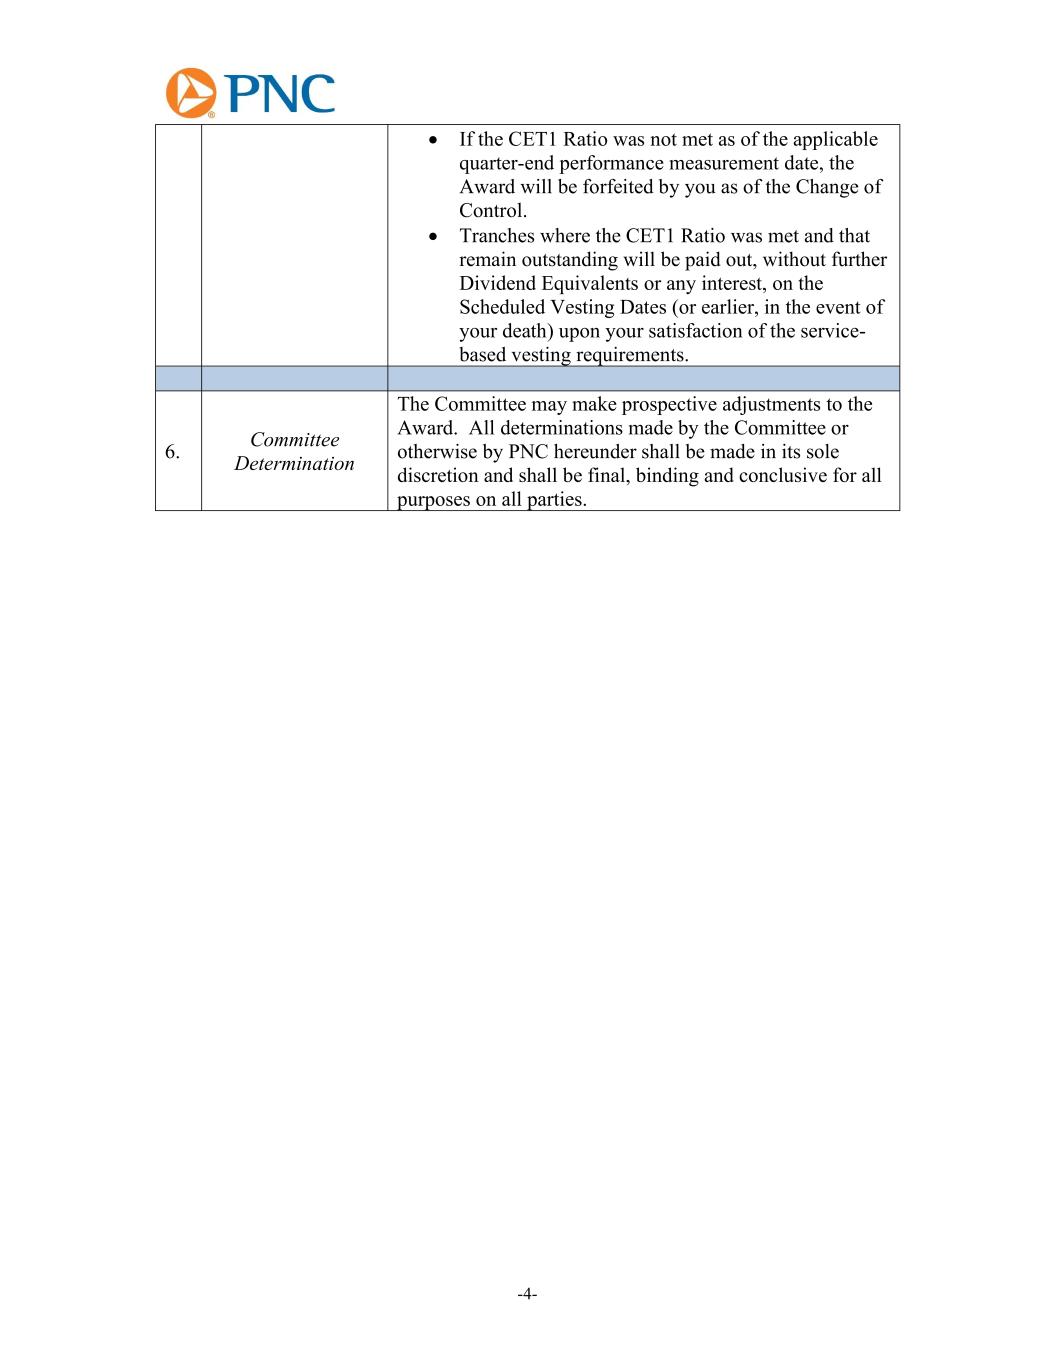
- a24rsu.htm (EX-10.31) — 57KB
- a24slr.htm (EX-10.32) — 60KB
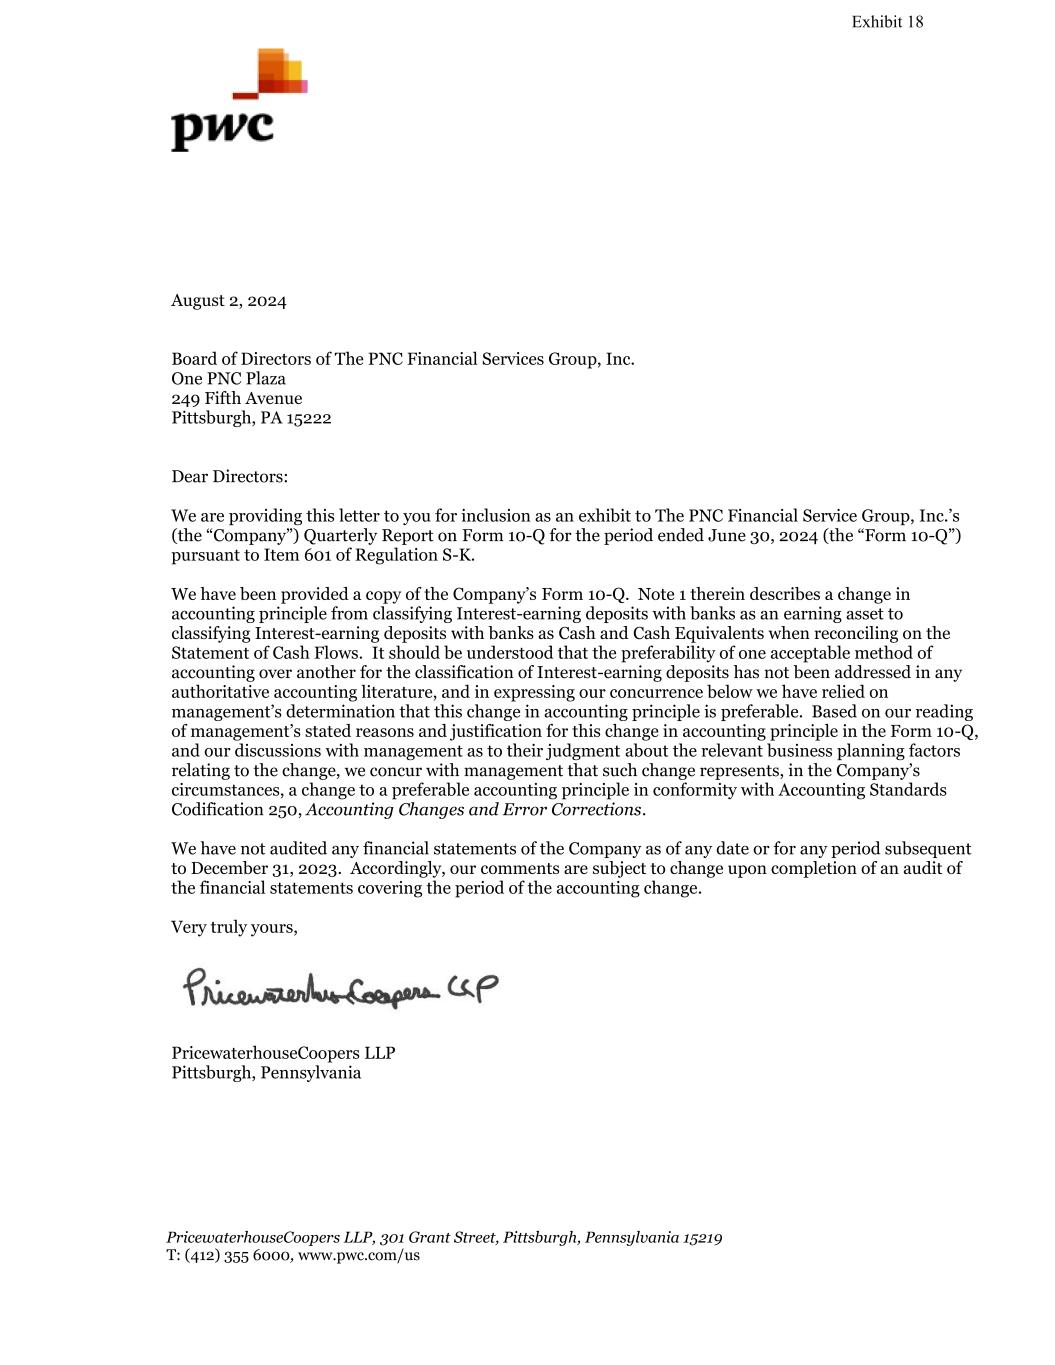
- pwcpreferabilityletter-c.htm (EX-18) — 3KB
- pnc-6302024xex22.htm (EX-22) — 3KB
- pnc-6302024xex311.htm (EX-31.1) — 10KB
- pnc-6302024xex312.htm (EX-31.2) — 10KB
- pnc-6302024xex321.htm (EX-32.1) — 5KB
- pnc-6302024xex322.htm (EX-32.2) — 5KB
- a24psufinal001.jpg (GRAPHIC) — 154KB
- a24psufinal002.jpg (GRAPHIC) — 177KB
- a24psufinal003.jpg (GRAPHIC) — 165KB
- a24psufinal004.jpg (GRAPHIC) — 181KB
- a24psufinal005.jpg (GRAPHIC) — 175KB
- a24psufinal006.jpg (GRAPHIC) — 171KB
- a24psufinal007.jpg (GRAPHIC) — 123KB
- a24psufinal008.jpg (GRAPHIC) — 199KB
- a24psufinal009.jpg (GRAPHIC) — 262KB
- a24psufinal010.jpg (GRAPHIC) — 218KB
- a24psufinal011.jpg (GRAPHIC) — 233KB
- a24psufinal012.jpg (GRAPHIC) — 237KB
- a24psufinal013.jpg (GRAPHIC) — 74KB
- a24psufinal014.jpg (GRAPHIC) — 223KB
- a24psufinal015.jpg (GRAPHIC) — 261KB
- a24psufinal016.jpg (GRAPHIC) — 233KB
- a24psufinal017.jpg (GRAPHIC) — 244KB
- a24psufinal018.jpg (GRAPHIC) — 239KB
- a24psufinal019.jpg (GRAPHIC) — 156KB
- a24psufinal020.jpg (GRAPHIC) — 158KB
- a24psufinal021.jpg (GRAPHIC) — 171KB
- a24psufinal022.jpg (GRAPHIC) — 184KB
- a24psufinal023.jpg (GRAPHIC) — 175KB
- a24psufinal024.jpg (GRAPHIC) — 169KB
- a24psufinal025.jpg (GRAPHIC) — 188KB
- a24psufinal026.jpg (GRAPHIC) — 185KB
- a24psufinal027.jpg (GRAPHIC) — 186KB
- a24psufinal028.jpg (GRAPHIC) — 66KB
- a24psufinal029.jpg (GRAPHIC) — 113KB
- a24psufinal030.jpg (GRAPHIC) — 52KB
- a24rsu001.jpg (GRAPHIC) — 172KB
- a24rsu002.jpg (GRAPHIC) — 167KB
- a24rsu003.jpg (GRAPHIC) — 177KB
- a24rsu004.jpg (GRAPHIC) — 155KB
- a24rsu005.jpg (GRAPHIC) — 172KB
- a24rsu006.jpg (GRAPHIC) — 173KB
- a24rsu007.jpg (GRAPHIC) — 174KB
- a24rsu008.jpg (GRAPHIC) — 194KB
- a24rsu009.jpg (GRAPHIC) — 269KB
- a24rsu010.jpg (GRAPHIC) — 221KB
- a24rsu011.jpg (GRAPHIC) — 234KB
- a24rsu012.jpg (GRAPHIC) — 239KB
- a24rsu013.jpg (GRAPHIC) — 76KB
- a24rsu014.jpg (GRAPHIC) — 221KB
- a24rsu015.jpg (GRAPHIC) — 253KB
- a24rsu016.jpg (GRAPHIC) — 220KB
- a24rsu017.jpg (GRAPHIC) — 253KB
- a24rsu018.jpg (GRAPHIC) — 209KB
- a24rsu019.jpg (GRAPHIC) — 173KB
- a24rsu020.jpg (GRAPHIC) — 184KB
- a24rsu021.jpg (GRAPHIC) — 184KB
- a24rsu022.jpg (GRAPHIC) — 83KB
- a24rsu023.jpg (GRAPHIC) — 52KB
- a24slr001.jpg (GRAPHIC) — 178KB
- a24slr002.jpg (GRAPHIC) — 159KB
- a24slr003.jpg (GRAPHIC) — 176KB
- a24slr004.jpg (GRAPHIC) — 164KB
- a24slr005.jpg (GRAPHIC) — 172KB
- a24slr006.jpg (GRAPHIC) — 173KB
- a24slr007.jpg (GRAPHIC) — 174KB
- a24slr008.jpg (GRAPHIC) — 190KB
- a24slr009.jpg (GRAPHIC) — 274KB
- a24slr010.jpg (GRAPHIC) — 221KB
- a24slr011.jpg (GRAPHIC) — 234KB
- a24slr012.jpg (GRAPHIC) — 239KB
- a24slr013.jpg (GRAPHIC) — 76KB
- a24slr014.jpg (GRAPHIC) — 212KB
- a24slr015.jpg (GRAPHIC) — 250KB
- a24slr016.jpg (GRAPHIC) — 213KB
- a24slr017.jpg (GRAPHIC) — 252KB
- a24slr018.jpg (GRAPHIC) — 230KB
- a24slr019.jpg (GRAPHIC) — 175KB
- a24slr020.jpg (GRAPHIC) — 186KB
- a24slr021.jpg (GRAPHIC) — 186KB
- a24slr022.jpg (GRAPHIC) — 187KB
- a24slr023.jpg (GRAPHIC) — 119KB
- a24slr024.jpg (GRAPHIC) — 52KB
- pnc-20240630_g1.jpg (GRAPHIC) — 84KB
- pwcpreferabilityletter-c001.jpg (GRAPHIC) — 155KB
- 0000713676-24-000068.txt ( ) — 53434KB
- pnc-20240630.xsd (EX-101.SCH) — 102KB
- pnc-20240630_cal.xml (EX-101.CAL) — 179KB
- pnc-20240630_def.xml (EX-101.DEF) — 753KB
- pnc-20240630_lab.xml (EX-101.LAB) — 1219KB
- pnc-20240630_pre.xml (EX-101.PRE) — 1023KB
- pnc-20240630_htm.xml (XML) — 9370KB
– FINANCIAL INFORMATION
PART I – FINANCIAL INFORMATION
Financial Statements (Unaudited)
Item 1. Financial Statements (Unaudited). Consolidated Income Statement 41 Consolidated Statement of Comprehensive Income 42 Consolidated Balance Sheet 43 Consolidated Statement of Cash Flows 44
Notes To Consolidated Financial Statements (Unaudited)
Notes To Consolidated Financial Statements (Unaudited) Note 1 Accounting Policies 46 Note 2 Investment Securities 47 Note 3 Loans and Related Allowance for Credit Losses 50 Note 4 Loan Sale and Servicing Activities and Variable Interest Entities 64 Note 5 Goodwill and Mortgage Servicing Rights 66 Note 6 Leases 68 Note 7 Borrowed Funds 69 Note 8 Commitments 70 Note 9 Total Equity and Other Comprehensive Income 71 Note 10 Earnings Per Share 74 Note 11 Fair Value 75 Note 12 Financial Derivatives 84 Note 13 Legal Proceedings 90 Note 14 Segment Reporting 91 Note 15 Fee-based Revenue from Contracts with Customers 95 Note 16 Subsequent Events 96 Statistical Information (Unaudited) Average Consolidated Balance Sheet And Net Interest Analysis 97 Reconciliation of Taxable-Equivalent Net Interest Income (non-GAAP) 99 Reconciliation of Noninterest Income Guidance, Excluding Significant Items (non-GAAP) 99 Reconciliation of Revenue Guidance, Excluding Significant Items (non-GAAP) 99 Reconciliation of Core Noninterest Expense Guidance (non-GAAP) 100 Glossary 100 Defined Terms 100 Acronyms 100
Management's Discussion and Analysis of Financial Condition and Results of Operations (MD&A)
Item 2. Management's Discussion and Analysis of Financial Condition and Results of Operations (MD&A). Financial Review 1 Executive Summary 1 Consolidated Income Statement Review 7 Consolidated Balance Sheet Review 10 Business Segments Review 13 Risk Management 20 Recent Regulatory Developments 36 Critical Accounting Estimates and Judgments 36 Internal Controls and Disclosure Controls and Procedures 38 Cautionary Statement Regarding Forward-Looking Information 39
Quantitative and Qualitative Disclosures about Market Risk. 21-38, 49-50,
Item 3. Quantitative and Qualitative Disclosures about Market Risk. 21-38, 49-50, 83-89
Controls and Procedures. 38
Item 4. Controls and Procedures. 38
– OTHER INFORMATION
PART II – OTHER INFORMATION
Legal Proceedings
Item 1. Legal Proceedings. 101
Risk Factors
Item 1A. Risk Factors. 101
Unregistered Sales of Equity Securities and Use of Proceeds
Item 2. Unregistered Sales of Equity Securities and Use of Proceeds. 101
Other Information
Item 5. Other Information 101
Exhibits
Item 6. Exhibits. 102 Exhibit Index 102 Corporate Information 102 Signature 104 MD&A TABLE REFERENCE Table Description Page 1 Summary of Operations, Per Common Share Data and Performance Ratios 2 2 Balance Sheet Highlights and Other Selected Ratios 3 3 Summarized Average Balances and Net Interest Income 7 4 Noninterest Income 8 5 Noninterest Expense 9 6 Provision for Credit Losses 9 7 Summarized Balance Sheet Data 10 8 Loans 11 9 Investment Securities 11 10 Weighted-Average Expected Maturities of Mortgage and Asset-Backed Debt Securities 12 11 Details of Funding Sources 12 12 Retail Banking Table 14 13 Corporate & Institutional Banking Table 16 14 Asset Management Group Table 19 15 Details of Loans 20 16 Commercial and Industrial Loans by Industry 21 17 Commercial Real Estate Loans by Geography and Property Type 22 18 Residential Real Estate Loan Statistics 23 19 Home Equity Loan Statistics 24 20 Auto Loan Statistics 24 21 Nonperforming Assets by Type 25 22 Change in Nonperforming Assets 25 23 Accruing Loans Past Due 26 24 Allowance for Credit Losses by Loan Class 27 25 Loan Charge-Offs and Recoveries 28 26 Senior and Subordinated Debt 29 27 Primary Contingent Liquidity Sources 29 28 Parent Company Notes Issued 30 29 Credit Ratings and Outlook 31 30 Basel III Capital 32 31 Net Interest Income Sensitivity Analysis 33 32 Economic Value of Equity Sensitivity Analysis 34 33 Equity Investments Summary 34 34 Key Macroeconomic Variables in CECL Weighted-Average Scenarios 37
NOTES TO CONSOLIDATED FINANCIAL STATEMENTS TABLE REFERENCE
NOTES TO CONSOLIDATED FINANCIAL STATEMENTS TABLE REFERENCE Table Description Page 35 Investment Securities Summary 47 36 Gross Unrealized Loss and Fair Value of Securities Available for Sale Without an Allowance for Credit Losses 48 37 Gains (Losses) on Sales of Securities Available for Sale 48 38 Contractual Maturity of Debt Securities 49 39 Fair Value of Securities Pledged and Accepted as Collateral 49 40 Analysis of Loan Portfolio 51 41 Nonperforming Assets 52 42 Commercial Credit Quality Indicators 53 43 Credit Quality Indicators for Residential Real Estate and Home Equity Loan Classes 54 44 Credit Quality Indicators for Automobile, Credit Card, Education and Other Consumer Loan Classes 56 45 Loan Modifications Granted to Borrowers Experiencing Financial Difficulty 58 46 Financial Effect of FDMs 60 47 Payment Performance of FDMs Modified in the Last 12 Months 62 48 Payment Performance of FDMs 62 49 Subsequently Defaulted FDMs 63 50 Rollforward of Allowance for Credit Losses 64 51 Loan Sale and Servicing Activities 65 52 Principal Balance, Delinquent Loans and Net Charge-offs Related to Serviced Loans For Others 65 53 Non-Consolidated VIEs 66 54 Mortgage Servicing Rights 67 55 Commercial Mortgage Servicing Rights – Key Valuation Assumptions 68 56 Residential Mortgage Servicing Rights – Key Valuation Assumptions 68 57 Lessor Income 68 58 Borrowed Funds 69 59 FHLB Borrowings, Senior Debt and Subordinated Debt 69 60 Commitments to Extend Credit and Other Commitments 70 61 Rollforward of Total Equity 71 62 Other Comprehensive Income (Loss) 72 63 Accumulated Other Comprehensive Income (Loss) Components 72 64 Dividends Per Share 73 65 Basic and Diluted Earnings Per Common Share 74 66 Fair Value Measurements – Recurring Basis Summary 75 67 Reconciliation of Level 3 Assets and Liabilities 76 68 Fair Value Measurements – Recurring Quantitative Information 80 69 Fair Val
Selected Financial Data
Selected Financial Data The following tables include selected financial data, which should be reviewed in conjunction with the Consolidated Financial Statements and Notes included in Item 1 of this Report as well as the other disclosures in this Report concerning our historical financial performance, our future prospects and the risks associated with our business and financial performance. Table 1: Summary of Operations, Per Common Share Data and Performance Ratios Dollars in millions, except per share data Unaudited Three months ended Six months ended June 30 March 31 June 30 June 30 June 30 2024 2024 2023 2024 2023 Summary of Operations (a) Net interest income $ 3,302 $ 3,264 $ 3,510 $ 6,566 $ 7,095 Noninterest income 2,109 1,881 1,783 3,990 3,801 Total revenue 5,411 5,145 5,293 10,556 10,896 Provision for credit losses 235 155 146 390 381 Noninterest expense 3,357 3,334 3,372 6,691 6,693 Income before income taxes and noncontrolling interests 1,819 1,656 1,775 3,475 3,822 Income taxes 342 312 275 654 628 Net income $ 1,477 $ 1,344 $ 1,500 $ 2,821 $ 3,194 Net income attributable to common shareholders $ 1,362 $ 1,247 $ 1,354 $ 2,609 $ 2,961 Per Common Share Basic $ 3.39 $ 3.10 $ 3.36 $ 6.49 $ 7.35 Diluted $ 3.39 $ 3.10 $ 3.36 $ 6.48 $ 7.34 Book value per common share $ 116.70 $ 113.30 $ 105.67 Performance Ratios Net interest margin (b) 2.60 % 2.57 % 2.79 % 2.58 % 2.81 % Noninterest income to total revenue 39 % 37 % 34 % 38 % 35 % Efficiency 62 % 65 % 64 % 63 % 61 % Return on: Average common shareholders' equity 12.16 % 11.39 % 13.01 % 11.78 % 14.53 % Average assets 1.05 % 0.97 % 1.08 % 1.01 % 1.15 % (a) The Executive Summary and Consolidated Income Statement Review portions of this Financial Review section provide information regarding items impacting the comparability of the periods presented. (b) See explanation and reconciliation of this non-GAAP measure in the Average Consolidated Balance Sheet and Net Interest Analysis and