Arrow Financial Corp. Q2 2024: Assets Rise, Net Income Grows
Ticker: AROW · Form: 10-Q · Filed: Aug 8, 2024 · CIK: 717538
Sentiment: bullish
Topics: earnings, financials, assets, deposits
Related Tickers: AROW
TL;DR
Arrow Financial Corp. (AROW) Q2 results: Assets up to $4.1B, Net Income $34.7M. Deposits $3.4B.
AI Summary
Arrow Financial Corp. reported its financial results for the period ending June 30, 2024. The company's total assets stood at $4.1 billion as of June 30, 2024, a slight increase from $4.0 billion at the end of 2023. Net income for the six months ended June 30, 2024, was $34.7 million, compared to $32.1 million for the same period in 2023. Deposits grew to $3.4 billion as of June 30, 2024.
Why It Matters
This filing provides insight into Arrow Financial Corp.'s financial health and performance, indicating growth in assets and profitability which could influence investor confidence and market perception.
Risk Assessment
Risk Level: low — The filing indicates stable financial performance with modest growth, suggesting a low-risk profile for the period covered.
Key Numbers
- $4.1B — Total Assets (As of June 30, 2024, showing an increase from year-end 2023.)
- $34.7M — Net Income (For the six months ended June 30, 2024, indicating improved profitability year-over-year.)
- $3.4B — Total Deposits (As of June 30, 2024, reflecting a key funding source for the bank.)
- $32.1M — Net Income (Prior Year) (For the six months ended June 30, 2023, for comparison.)
Key Players & Entities
- ARROW FINANCIAL CORP (company) — Filer
- 20240630 (date) — Period of Report
- $4.1 billion (dollar_amount) — Total Assets as of June 30, 2024
- $4.0 billion (dollar_amount) — Total Assets as of December 31, 2023
- $34.7 million (dollar_amount) — Net Income for six months ended June 30, 2024
- $32.1 million (dollar_amount) — Net Income for six months ended June 30, 2023
- $3.4 billion (dollar_amount) — Deposits as of June 30, 2024
FAQ
What was Arrow Financial Corp.'s total asset value as of June 30, 2024?
As of June 30, 2024, Arrow Financial Corp.'s total assets were $4.1 billion.
How did Arrow Financial Corp.'s net income for the first six months of 2024 compare to the same period in 2023?
Net income for the six months ended June 30, 2024, was $34.7 million, an increase from $32.1 million for the same period in 2023.
What was the total amount of deposits held by Arrow Financial Corp. as of June 30, 2024?
Total deposits for Arrow Financial Corp. stood at $3.4 billion as of June 30, 2024.
What is Arrow Financial Corp.'s fiscal year end?
Arrow Financial Corp.'s fiscal year ends on December 31.
What is the primary industry classification for Arrow Financial Corp.?
Arrow Financial Corp. is classified under NATIONAL COMMERCIAL BANKS [6021].
Filing Stats: 4,727 words · 19 min read · ~16 pages · Grade level 17.9 · Accepted 2024-08-08 14:22:39
Key Financial Figures
- $1.00 — ich Registered Common Stock, Par Value $1.00 per share AROW NASDAQ Global Select Mar
- $250,000 — 1,466,280 1,517,937 Time Deposits over $250,000 173,526 179,301 140,694 Other Time Dep
Filing Documents
- arow-20240630.htm (10-Q) — 3759KB
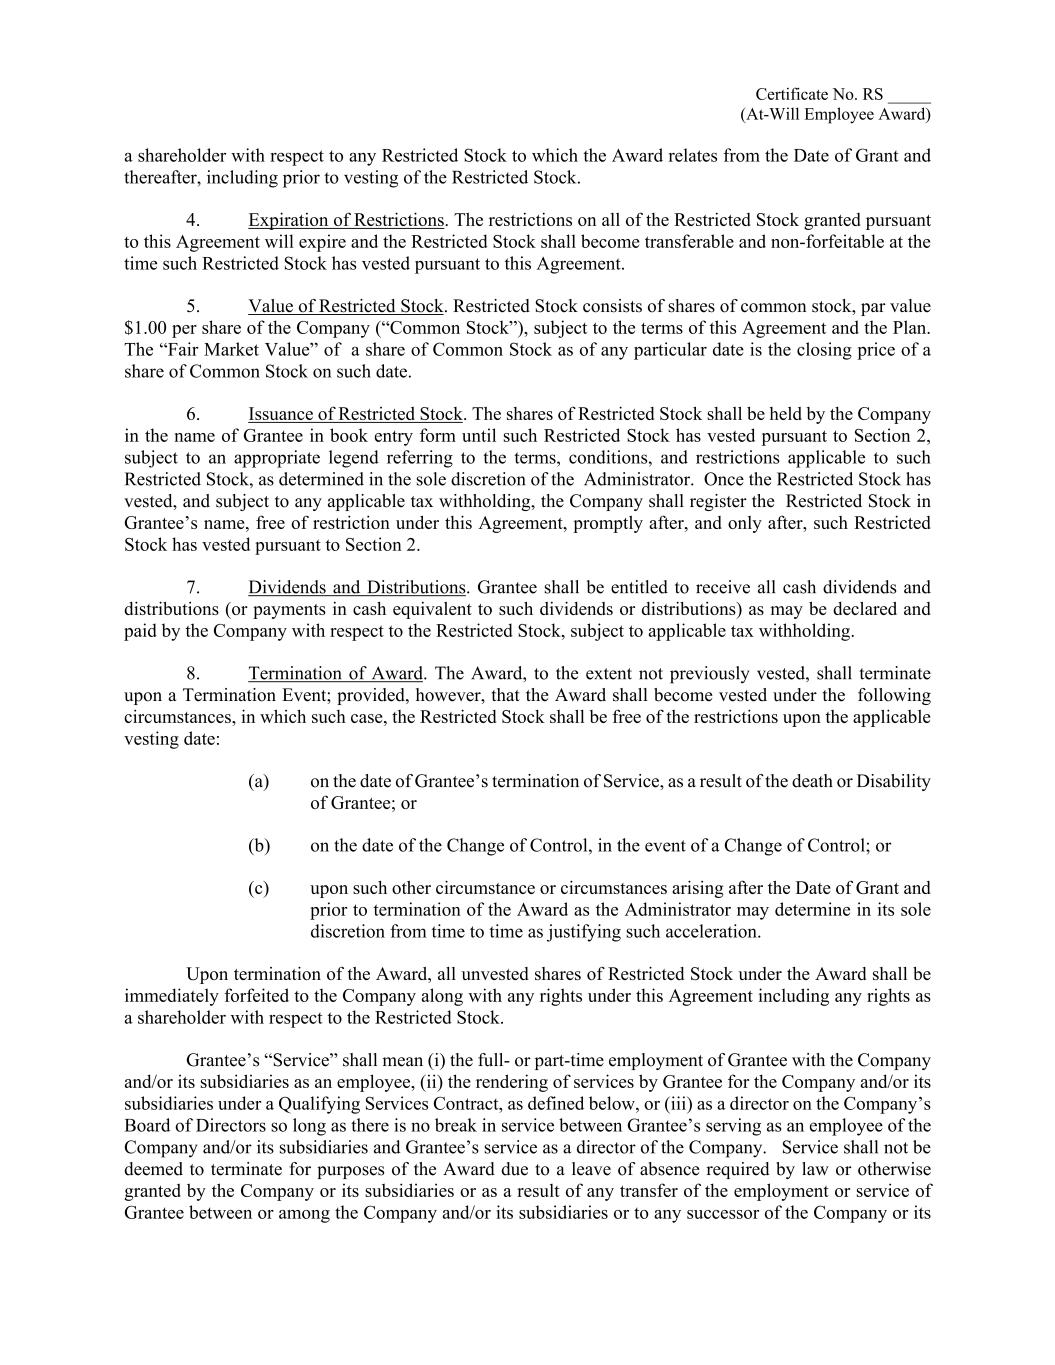
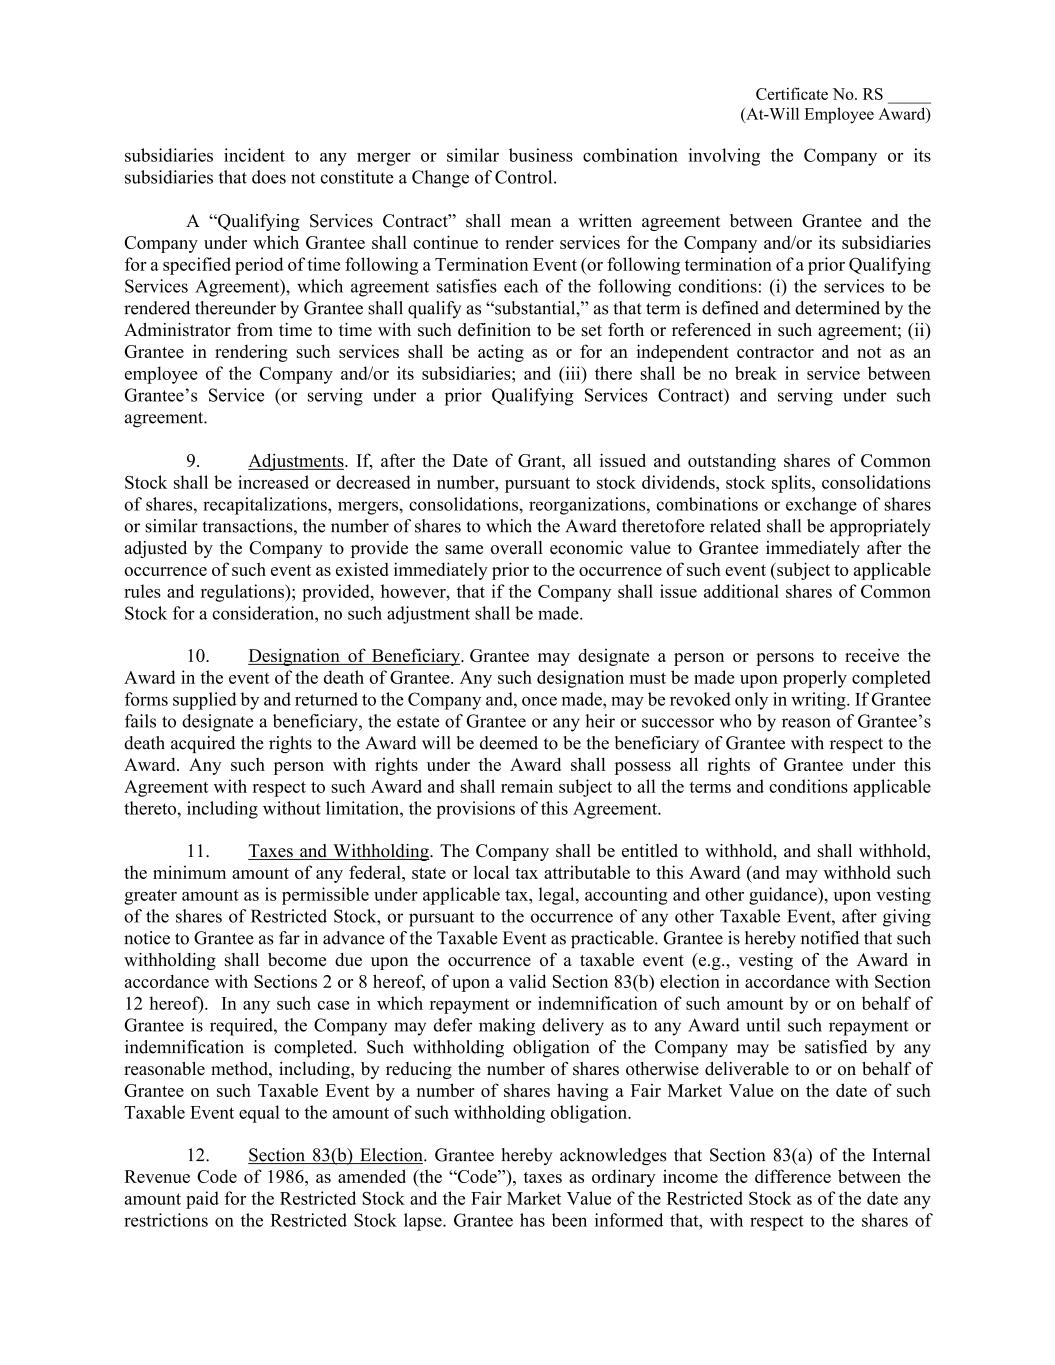
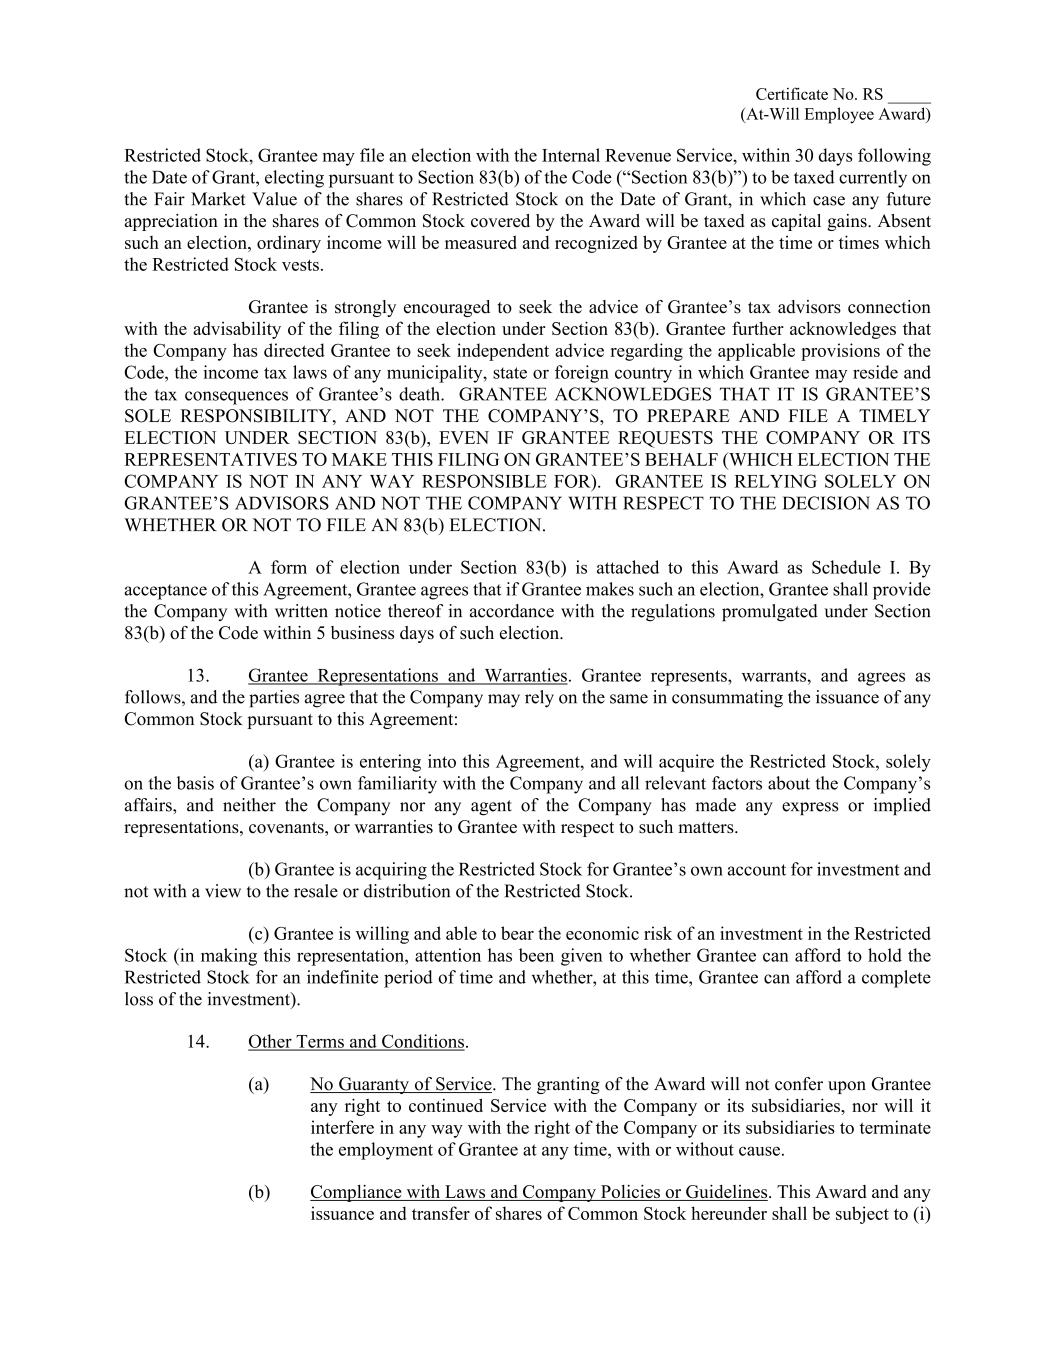
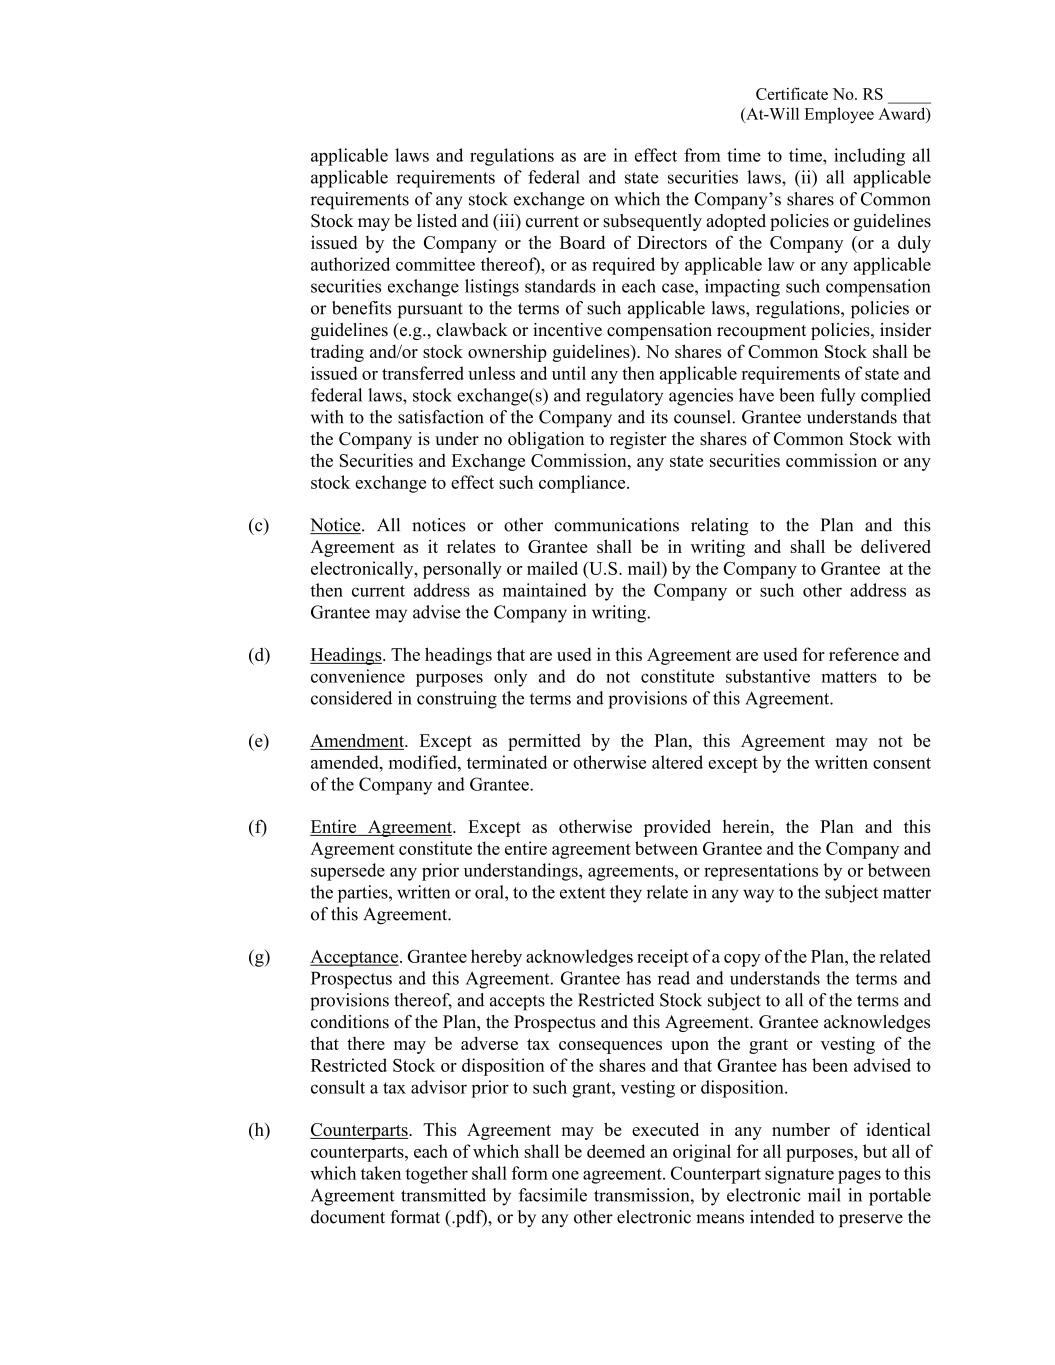
- singletriggeratwill.htm (EX-10.1) — 23KB
- doubletriggercontractede.htm (EX-10.2) — 28KB
- nonemployeedirectors.htm (EX-10.3) — 22KB
- ex311ceoq22024.htm (EX-31.1) — 8KB
- ex312cfoq22024.htm (EX-31.2) — 8KB
- ex32906cert-q22024.htm (EX-32.1) — 6KB
- doubletriggercontractede001.jpg (GRAPHIC) — 205KB
- doubletriggercontractede002.jpg (GRAPHIC) — 248KB
- doubletriggercontractede003.jpg (GRAPHIC) — 307KB
- doubletriggercontractede004.jpg (GRAPHIC) — 300KB
- doubletriggercontractede005.jpg (GRAPHIC) — 250KB
- doubletriggercontractede006.jpg (GRAPHIC) — 209KB
- doubletriggercontractede007.jpg (GRAPHIC) — 25KB
- doubletriggercontractede008.jpg (GRAPHIC) — 46KB
- doubletriggercontractede009.jpg (GRAPHIC) — 107KB
- doubletriggercontractede010.jpg (GRAPHIC) — 57KB
- nonemployeedirectors001.jpg (GRAPHIC) — 189KB
- nonemployeedirectors002.jpg (GRAPHIC) — 230KB
- nonemployeedirectors003.jpg (GRAPHIC) — 265KB
- nonemployeedirectors004.jpg (GRAPHIC) — 251KB
- nonemployeedirectors005.jpg (GRAPHIC) — 214KB
- nonemployeedirectors006.jpg (GRAPHIC) — 61KB
- nonemployeedirectors007.jpg (GRAPHIC) — 46KB
- nonemployeedirectors008.jpg (GRAPHIC) — 107KB
- nonemployeedirectors009.jpg (GRAPHIC) — 56KB
- singletriggeratwill001.jpg (GRAPHIC) — 205KB
- singletriggeratwill002.jpg (GRAPHIC) — 249KB
- singletriggeratwill003.jpg (GRAPHIC) — 301KB
- singletriggeratwill004.jpg (GRAPHIC) — 252KB
- singletriggeratwill005.jpg (GRAPHIC) — 235KB
- singletriggeratwill006.jpg (GRAPHIC) — 54KB
- singletriggeratwill007.jpg (GRAPHIC) — 46KB
- singletriggeratwill008.jpg (GRAPHIC) — 107KB
- singletriggeratwill009.jpg (GRAPHIC) — 57KB
- 0000717538-24-000100.txt ( ) — 24208KB
- arow-20240630.xsd (EX-101.SCH) — 56KB
- arow-20240630_cal.xml (EX-101.CAL) — 127KB
- arow-20240630_def.xml (EX-101.DEF) — 407KB
- arow-20240630_lab.xml (EX-101.LAB) — 935KB
- arow-20240630_pre.xml (EX-101.PRE) — 673KB
- arow-20240630_htm.xml (XML) — 4386KB
- FINANCIAL INFORMATION
PART I - FINANCIAL INFORMATION
Financial Statements
Item 1. Financial Statements 3
Management's Discussion and Analysis of Financial Condition and Results of Operations
Item 2. Management's Discussion and Analysis of Financial Condition and Results of Operations 48
Quantitative and Qualitative Disclosures About Market Risk
Item 3. Quantitative and Qualitative Disclosures About Market Risk 74
Controls and Procedures
Item 4. Controls and Procedures 74
- OTHER INFORMATION
PART II - OTHER INFORMATION
Legal Proceedings
Item 1. Legal Proceedings 76
A. Risk Factors
Item 1.A. Risk Factors 76
Unregistered Sales of Equity Securities and Use of Proceeds
Item 2. Unregistered Sales of Equity Securities and Use of Proceeds 76
Defaults Upon Senior Securities
Item 3. Defaults Upon Senior Securities 77
Mine Safety Disclosures
Item 4. Mine Safety Disclosures 77
Other Information
Item 5. Other Information 77
Exhibits
Item 6. Exhibits 77
- FINANCIAL INFORMATION
PART I - FINANCIAL INFORMATION
FINANCIAL STATEMENTS
Item 1. FINANCIAL STATEMENTS ARROW FINANCIAL CORPORATION AND SUBSIDIARIES CONSOLIDATED BALANCE SHEETS (In Thousands, Except Share and Per Share Amounts) (Unaudited) June 30, 2024 December 31, 2023 June 30, 2023 ASSETS Cash and Due From Banks $ 30,372 $ 36,755 $ 33,803 Interest-Bearing Deposits at Banks 169,826 105,781 139,798 Investment Securities: Available-for-Sale at Fair Value 450,786 497,769 543,708 Held-to-Maturity (Fair Value of $ 96,454 at June 30, 2024; $ 128,837 at December 31, 2023; and $ 139,143 at June 30, 2023) 99,348 131,395 143,460 Equity Securities 1,996 1,925 1,889 Other Investments 4,274 5,049 4,932 Loans 3,315,523 3,212,908 3,069,897 Allowance for Credit Losses ( 31,009 ) ( 31,265 ) ( 31,170 ) Net Loans 3,284,514 3,181,643 3,038,727 Premises and Equipment, Net 59,243 59,642 59,773 Goodwill 21,873 21,873 21,873 Other Intangible Assets, Net 927 1,110 1,302 Other Assets 121,248 126,926 114,388 Total Assets $ 4,244,407 $ 4,169,868 $ 4,103,653 LIABILITIES Noninterest-Bearing Deposits $ 704,707 $ 758,425 $ 759,495 Interest-Bearing Checking Accounts 856,788 799,785 856,016 Savings Deposits 1,446,821 1,466,280 1,517,937 Time Deposits over $250,000 173,526 179,301 140,694 Other Time Deposits 501,797 483,775 228,082 Total Deposits 3,683,639 3,687,566 3,502,224 Borrowings 106,500 26,500 171,800 Junior Subordinated Obligations Issued to Unconsolidated Subsidiary Trusts 20,000 20,000 20,000 Finance Leases 5,038 5,066 5,093 Other Liabilities 46,212 50,964 43,093 Total Liabilities 3,861,389 3,790,096 3,742,210 STOCKHOLDERS' EQUITY Preferred Stock, $ 1 Par Value and 1,000,000 Shares Authorized at June 30, 2024, December 31, 2023 and June 30, 2023 — — — Common Stock, $ 1 Par Value; 30,000,000 Shares Authorized ( 22,066,559 Shares Issued at June 30, 2024 and December 31, 2023 and 21,423,992 Shares Issued at June 30, 2023) 22,067 22,067 21,424 Additional Paid-in Capital 412,917 412,551 401,069 Retained Earnings 72,980 65